
When dealing with imbalanced datasets, evaluating model performance can get tricky. Traditional metrics might paint a misleading picture, and that’s where comparing AUC (Area Under the Curve) with the Precision-Recall (PR) Curve becomes crucial.
Let’s dive into these concepts and understand why AUC can fail in such scenarios.
What is AUC, and Why is It Popular?
Understanding AUC-ROC
The AUC-ROC Curve (Area Under the Receiver Operating Characteristic Curve) is a go-to metric in machine learning. It plots the True Positive Rate (TPR) against the False Positive Rate (FPR), measuring how well your model distinguishes between classes.
Why AUC is Commonly Used
- Intuitive Interpretation: AUC ranges from 0 to 1. The closer to 1, the better the model.
- Threshold Independence: It evaluates performance across various classification thresholds.
- Balanced Focus: Considers both positive and negative classes equally.
For balanced datasets, AUC is often reliable. But problems arise when dealing with imbalanced datasets where one class dominates the other.
The Problem with AUC in Imbalanced Datasets
False Positives Lose Significance
In imbalanced datasets, the minority class is overshadowed. AUC emphasizes FPR, which can appear small simply because there are few negative samples compared to positives. This skews the perception of performance.
Misleading High Scores
AUC-ROC may yield deceptively high values even if the model performs poorly for the minority class. For example:
- A model predicting all negatives in a 95%-negative dataset might score well because it rarely raises false alarms.
Ignoring Precision and Recall
AUC doesn’t directly address precision (positive predictive value) or recall (sensitivity). These metrics are often more critical in imbalanced scenarios, where detecting the minority class is key.
Precision-Recall Curve: A Better Alternative
What is the PR Curve?
The Precision-Recall Curve plots precision against recall at various thresholds, focusing on the minority class performance. It highlights how well a model balances the trade-off between:
- Precision: Correct positive predictions out of total positive predictions.
- Recall: Correct positive predictions out of all actual positives.
Why PR Excels with Imbalance
- Focus on Positives: It zeroes in on the minority class, making it more relevant for imbalanced datasets.
- Avoids FPR Bias: Unlike AUC-ROC, it doesn’t rely on false negatives, which can dominate skewed datasets.
When minority class detection matters most, the PR curve often provides a clearer view of model success.
When Should You Use PR Over AUC?
Key Scenarios Favoring PR Curves
- Highly Imbalanced Datasets: PR curves excel when one class vastly outweighs the other.
- Minority Class Priority: If missing a minority instance (e.g., fraud detection) has high stakes.
- Precision-Centric Needs: For applications where false positives are costly, such as medical diagnoses.
When AUC Still Works
AUC remains useful for balanced datasets or when you’re interested in overall classification performance, including the negative class.
Comparing AUC and Precision-Recall in Practice

Now that we’ve laid the groundwork, let’s dive deeper into practical comparisons between AUC-ROC and Precision-Recall (PR) curves. Understanding their differences can help you choose the best metric for evaluating your model, especially when working with imbalanced datasets.
Key Differences Between AUC-ROC and PR Curves
1. Class Distribution Sensitivity
- AUC-ROC: Remains stable across varying class distributions but can mislead when the negative class dominates.
- PR Curve: Reacts more directly to changes in the positive class distribution, making it more meaningful in imbalance-heavy scenarios.
2. Focus on Positive Class
- AUC-ROC: Balances performance between both classes, often masking poor minority-class detection.
- PR Curve: Prioritizes positive class detection, showing how well the model handles the minority class.
3. Interpretability
- AUC-ROC: Simple to understand for general performance, but not specific enough for critical minority class analysis.
- PR Curve: Offers detailed insight into precision and recall trade-offs, which are often more actionable.
4. Metric Values
- AUC-ROC: Scores near 0.5 indicate random guessing, while scores close to 1 show strong performance.
- PR Curve (AUC-PR): Even a moderate score (e.g., 0.5) can represent solid minority-class performance, depending on dataset imbalance.

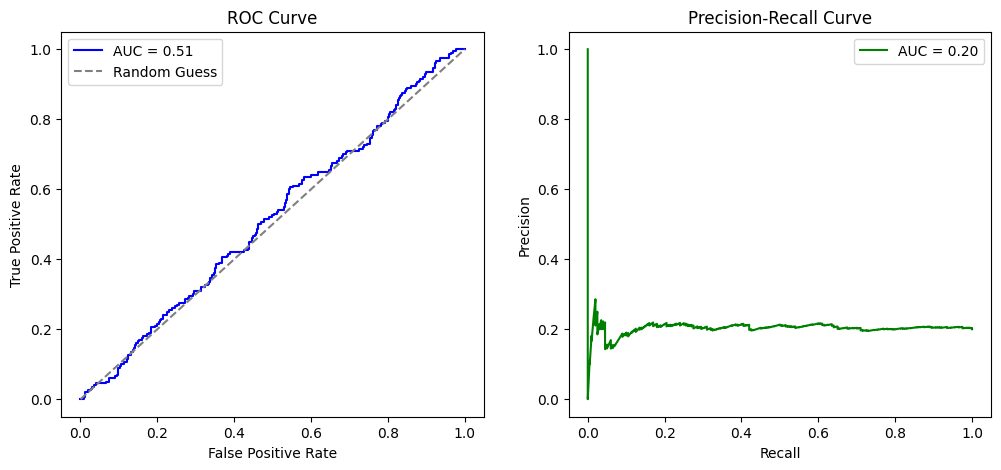
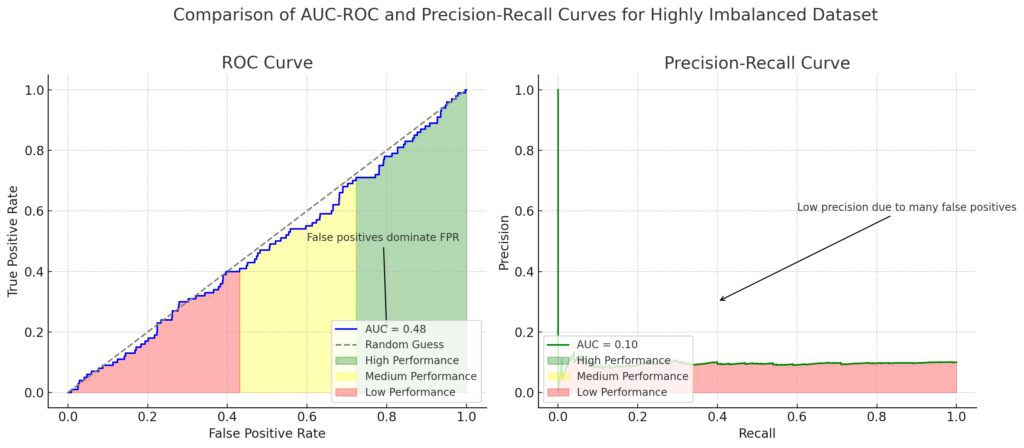
Practical Examples of AUC vs. PR Curve
Scenario 1: Fraud Detection
In fraud detection, fraudulent transactions make up a tiny portion of the dataset. A high AUC-ROC might look great but could hide poor fraud detection. The PR curve, focusing on precision and recall, reveals if the model is actually catching fraudulent cases.
Scenario 2: Medical Diagnoses
When diagnosing rare diseases, false negatives can be catastrophic. Here, recall is crucial, and the PR curve provides more actionable insights than AUC-ROC.
Scenario 3: Marketing Campaigns
For classifying likely responders in a sea of non-responders, precision becomes critical. The PR curve helps measure how well the model avoids wasting resources on unlikely candidates.
Best Practices for Using PR Curves
1. Focus on AUC-PR Values
Instead of just visualizing the PR curve, calculate the area under the PR curve (AUC-PR). It provides a single number for comparing models.
2. Evaluate at Specific Thresholds
Inspect precision and recall at decision-making thresholds. This helps fine-tune your model for real-world scenarios.
3. Use F1 Score for Trade-Off Analysis
The F1 score combines precision and recall, offering a balanced view of performance. It’s particularly helpful when both metrics are critical.
Should You Abandon AUC-ROC Completely?
Not necessarily. While AUC-ROC isn’t ideal for highly imbalanced datasets, it still provides value for balanced problems or when overall classification ability matters. Use it alongside PR curves rather than as a standalone metric.
By understanding these metrics’ strengths and weaknesses, you can better assess your model’s true performance. Tailoring your evaluation approach ensures your model works not just on paper but in real-world applications.
How to Generate and Interpret PR Curves
1. Generating the PR Curve
To create a PR curve, follow these steps:
- Step 1: Use a model to calculate predicted probabilities for your dataset.
- Step 2: Compute precision and recall at different thresholds.
- Step 3: Plot recall on the x-axis and precision on the y-axis.
In Python, you can generate PR curves using scikit-learn:
from sklearn.metrics import precision_recall_curve, auc

# Calculate precision, recall, and thresholds
precision, recall, thresholds = precision_recall_curve(y_true, y_scores)

# Plot the Precision-Recall Curve
import matplotlib.pyplot as plt
plt.plot(recall, precision, marker='.')
plt.xlabel('Recall')
plt.ylabel('Precision')
plt.title('Precision-Recall Curve')
plt.show()
2. Calculating AUC-PR
The area under the PR curve (AUC-PR) gives a single value summarizing the curve. Higher AUC-PR values indicate better performance for the positive class.
# Calculate AUC-PR
auc_pr = auc(recall, precision)
print("AUC-PR:", auc_pr)
Analyzing PR Curves for Model Tuning
1. Observe the Curve’s Shape
- A steep initial rise indicates the model identifies positives with high precision at certain thresholds.
- A flat curve suggests the model struggles to improve precision as recall increases.
2. Threshold Selection
Identify the threshold that balances precision and recall based on your goals. For example:
- High recall (low threshold): Best for cases like cancer detection, where missing positives is critical.
- High precision (high threshold): Suitable for fraud detection, where false positives can be costly.
3. Compare Models
Use the AUC-PR to objectively compare different models or tuning iterations. Focus on the area under the curve instead of a single threshold.
Common Pitfalls When Using PR Curves
1. Ignoring Class Imbalance
Ensure the minority class is well-represented in your test data. Skewed splits can distort PR metrics.
2. Misinterpreting AUC-PR
A lower AUC-PR compared to AUC-ROC doesn’t mean the model is worse. It reflects positive class-focused performance, which might still be strong for an imbalanced dataset.
3. Overemphasizing Threshold-Specific Values
While precision and recall at specific thresholds are useful, they don’t represent overall performance. Always consider the entire PR curve.
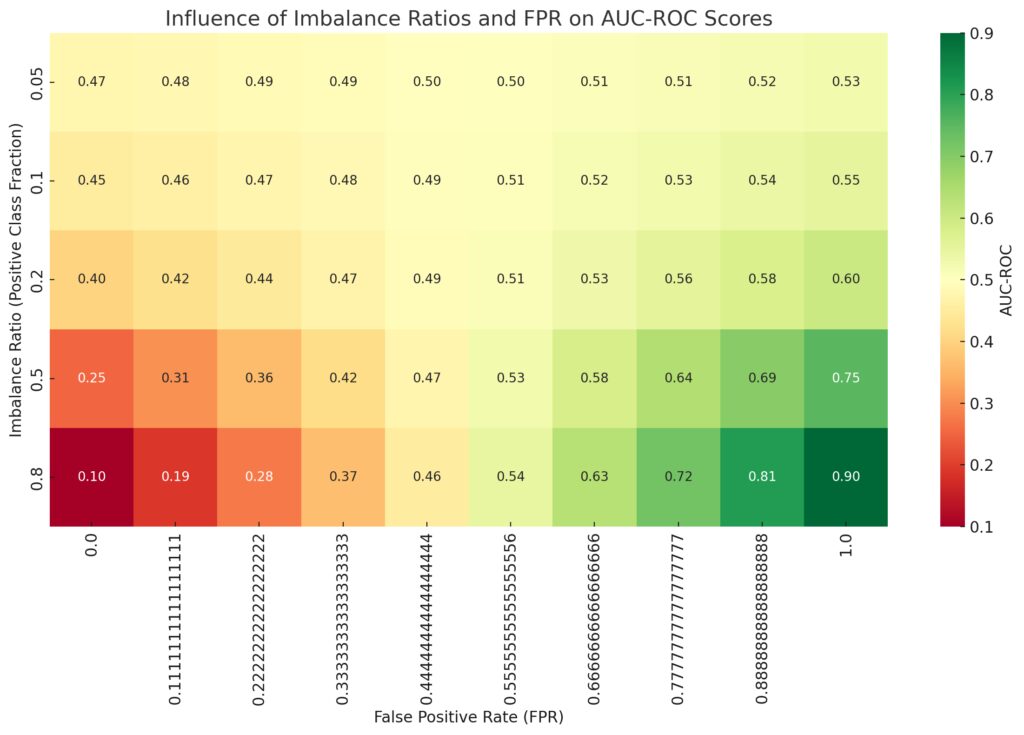
Higher imbalance ratios (e.g., 0.05) generally show reduced AUC-ROC, particularly when FPR is significant.
High AUC-ROC can still occur even with poor minority-class performance because AUC-ROC aggregates overall performance and can be skewed by the majority class.
Note:
AUC-ROC may overestimate model performance in imbalanced datasets. For evaluating minority-class performance, consider using metrics like Precision-Recall curves or class-specific metrics.
How PR Curves Outperform AUC-ROC in Imbalanced Datasets
Direct Measurement of Positive Class
Unlike AUC-ROC, PR curves don’t dilute positive class performance by emphasizing negatives. This makes them a better fit for problems like fraud detection or rare disease prediction.
Clarity in Trade-Offs
The explicit trade-off between precision and recall in PR curves helps decision-makers set thresholds based on operational needs.
Sensitivity to Changes in Positive Class
PR curves are more sensitive to changes in how the model handles the minority class, making them better for fine-tuning.
In conclusion, PR curves aren’t just a tool—they’re a lens through which you can view and refine your model’s real-world impact. By applying these techniques thoughtfully, you ensure your evaluations truly reflect your model’s strengths and weaknesses.
Decision Tree
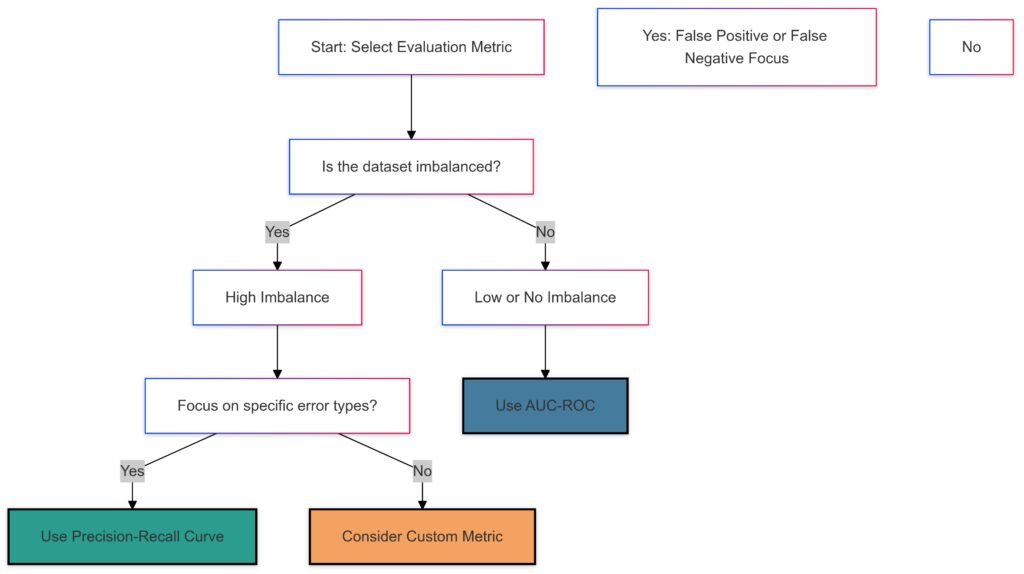
Decision Tree Explanation:
- Start: Begin by assessing the dataset characteristics.
- Is the dataset imbalanced?
- Yes (High Imbalance): Check whether the focus is on specific error types.
- Yes (Specific Focus): Use the Precision-Recall Curve for better handling of rare events and error prioritization.
- No (General Performance): Consider a custom metric tailored to the specific problem.
- No (Low Imbalance): Use the AUC-ROC curve for a comprehensive view of model performance across all thresholds.
- Yes (High Imbalance): Check whether the focus is on specific error types.
Key Points Covered:
- What is AUC-ROC and Why It’s Popular?
- Defined AUC-ROC and its strengths, especially in balanced datasets.
- The Problem with AUC in Imbalanced Datasets
- Highlighted how AUC-ROC can mislead when false positives dominate or when the minority class is critical.
- Precision-Recall Curve as a Better Alternative
- Explained how PR curves focus on positive class performance, making them ideal for imbalanced datasets.
- Comparing AUC-ROC and PR Curves
- Detailed their differences, scenarios favoring each metric, and examples like fraud detection and medical diagnoses.
- Implementing Precision-Recall Curves
- Provided practical guidance on generating PR curves, interpreting results, and using them to tune models.
- Avoiding Pitfalls and Maximizing Impact
- Highlighted common issues with PR curves and how to avoid them for robust model evaluation.
FAQs
Can I use both AUC-ROC and Precision-Recall curves together?
Yes, using both metrics can provide a more complete understanding of your model’s performance. AUC-ROC offers an overall view, while Precision-Recall curves give deeper insights into the minority class performance.
How do I calculate AUC-PR in Python?
You can calculate AUC-PR using the auc function from scikit-learn:
from sklearn.metrics import precision_recall_curve, auc
precision, recall, _ = precision_recall_curve(y_true, y_scores)
auc_pr = auc(recall, precision)
What is the role of thresholds in these metrics?
Thresholds determine the decision boundary for classifying predictions. Adjusting thresholds impacts precision, recall, and F1 score. Both AUC-ROC and Precision-Recall curves evaluate performance across a range of thresholds, allowing you to identify the best trade-offs for your application.
Why is the F1 score often used with Precision-Recall curves?
The F1 score combines precision and recall into a single metric, offering a balanced measure of performance. It’s particularly useful when both false positives and false negatives carry significant consequences. The F1 score helps highlight the trade-off between these two metrics in a clear and actionable way.
Can I rely solely on AUC-PR for model evaluation?
While AUC-PR is excellent for assessing minority class performance, it doesn’t provide insights into the negative class or overall performance. If both classes are important, consider combining AUC-PR with AUC-ROC or other metrics like accuracy or the Matthews Correlation Coefficient (MCC).
How does class imbalance affect Precision-Recall metrics?
Class imbalance directly impacts precision because it depends on the proportion of true positives to all predicted positives. A highly imbalanced dataset with few positives may result in low precision unless the model is very accurate in predicting the positive class. Recall, on the other hand, measures how well the model captures all actual positives and is less affected by imbalance.
What are some real-world applications of Precision-Recall curves?
Precision-Recall curves are crucial in applications like:
- Fraud detection: Where precision is key to reducing false positives.
- Medical diagnosis: Where recall is prioritized to minimize false negatives.
- Search engines: For ranking results where both precision and recall play a role.
Is a high Precision-Recall AUC always desirable?
Yes, but the context matters. A high AUC-PR indicates strong performance in detecting the minority class. However, if the application tolerates some false positives (lower precision) to improve recall, you might prioritize thresholds that maximize recall over precision, even at the expense of AUC-PR.
How do I choose the best threshold for my model?
The ideal threshold depends on your application’s priorities:
- For high precision (minimizing false positives), choose a higher threshold.
- For high recall (capturing all positives), select a lower threshold.
You can also use metrics like the F1 score or cost-based analysis to identify the most practical threshold.
Can AUC-ROC and Precision-Recall curves be misleading?
Both metrics have limitations:
- AUC-ROC can inflate performance in imbalanced datasets due to its reliance on the false positive rate.
- Precision-Recall curves focus only on the positive class, potentially ignoring overall model balance.
It’s important to choose metrics aligned with your business goals and dataset characteristics.
Are there alternatives to AUC-ROC and Precision-Recall curves?
Yes, depending on your use case, consider:
- F1 Score: For balanced precision and recall.
- Matthews Correlation Coefficient (MCC): For overall performance in imbalanced datasets.
- Specificity and Sensitivity: For domain-specific requirements like healthcare.
How can I visually compare models using Precision-Recall curves?
Plot the Precision-Recall curves of multiple models on the same graph. The model with the highest area under the curve (AUC-PR) generally performs better in detecting the minority class. Add markers to highlight key thresholds or the optimal operating point for each model.
What does a steep drop in the Precision-Recall curve indicate?
A steep drop in the curve suggests that as recall increases, precision decreases rapidly. This usually means the model starts predicting more false positives to achieve higher recall. Such behavior might indicate poor generalization or overfitting to the training data.
How do Precision-Recall curves help in imbalanced classification?
Precision-Recall curves focus on the minority class, which is often the target in imbalanced datasets. By highlighting precision and recall trade-offs, they help ensure the model effectively detects positives without being overwhelmed by the dominant negative class.
What is the relationship between Precision-Recall curves and the F1 score?
The F1 score is a single-point summary of the Precision-Recall trade-off. It represents the harmonic mean of precision and recall at a specific threshold. Precision-Recall curves show the entire spectrum of precision and recall values, while the F1 score pinpoints the balance at a chosen threshold.
Why might AUC-PR be lower than expected even with good recall?
High recall alone doesn’t guarantee a high AUC-PR. If the precision is consistently low, the area under the PR curve will be small. This often happens in imbalanced datasets if the model struggles to reduce false positives while maximizing recall.
How can I improve my model’s Precision-Recall performance?
To enhance Precision-Recall performance:
- Optimize thresholds: Experiment with different decision thresholds to find the ideal trade-off.
- Resample data: Use techniques like oversampling (e.g., SMOTE) or undersampling to balance classes.
- Use class-specific weights: Adjust model loss functions to penalize errors on the minority class more heavily.
- Feature engineering: Add or modify features to improve class separability.
What’s a good AUC-PR value for imbalanced datasets?
There’s no universal threshold for a “good” AUC-PR score, as it depends on your dataset and use case. However, for imbalanced datasets, even moderate scores (e.g., 0.5 or 0.6) can indicate a strong ability to identify the minority class compared to random guessing.
How does dataset size affect Precision-Recall metrics?
Smaller datasets may produce less reliable Precision-Recall metrics due to limited examples of the minority class. In such cases:
- Use cross-validation to estimate performance across multiple splits.
- Consider augmenting the dataset through synthetic data generation or external data sources.
What role do sampling methods play in AUC-PR and AUC-ROC?
Sampling techniques like oversampling or undersampling can significantly affect both metrics.
- For AUC-ROC, they balance the class distribution, potentially reducing the bias towards the negative class.
- For AUC-PR, they increase the representation of the minority class, helping the model better focus on positive predictions.
How can I visualize the impact of class imbalance on AUC-PR and AUC-ROC?
Create side-by-side plots showing metrics for datasets with different class distributions. For example:
- A balanced dataset (e.g., 50% positives).
- An imbalanced dataset (e.g., 95% negatives).
This demonstrates how AUC-ROC remains stable but AUC-PR reflects the challenges of imbalance.
Can I use the same Precision-Recall curve for multiclass problems?
For multiclass classification, Precision-Recall curves are typically generated for each class using a one-vs-all approach. Alternatively, you can compute a micro-averaged PR curve, which aggregates performance across all classes, or a macro-average, which calculates the unweighted mean performance for each class.
Resources
Tutorials and Blogs
- Precision-Recall vs. ROC Curves for Imbalanced Classification (Machine Learning Mastery):
Comprehensive guide to understanding when and how to use these metrics. - Hands-On Guide to Precision-Recall and ROC Curves (Towards Data Science):
Step-by-step tutorial for plotting and interpreting curves using Python. - Deep Learning Metrics Explained (Analytics Vidhya):
Discusses these metrics in the context of deep learning models.
Interactive Tools and Platforms
- Google Colab:
An excellent platform for running Python code snippets related to AUC-ROC and PR curves.
Try Google Colab - Streamlit and Plotly Dash:
Create interactive dashboards to visualize Precision-Recall curves dynamically.
Streamlit | Plotly Dash - Teachable Machine (Google):
A no-code tool for building models and evaluating metrics, perfect for beginners.
Visit Teachable Machine
Datasets for Practice
- Kaggle:
A treasure trove of datasets to experiment with classification problems.
Explore Kaggle Datasets - UCI Machine Learning Repository:
Offers real-world datasets for testing AUC-ROC and PR metrics on imbalanced problems.
Visit UCI Repository


