Focal Loss is a powerful tool in imbalanced classification problems, especially for tasks like object detection or rare event prediction. But getting the best performance out of it requires fine-tuning its hyperparameters—particularly the gamma parameter
This guide will walk you through the what, why, and how of tuning gamma for maximum effectiveness.
Understanding the Gamma Parameter in Focal Loss
What is Focal Loss?
Focal Loss modifies the standard cross-entropy loss to address class imbalance issues. It does so by adding a modulating factor to reduce the loss for well-classified examples, allowing the model to focus more on hard-to-classify samples.
The formula looks like this:
[math]FL(p t)=−α(1−p t) γlog(p t)[/math]
Here, gamma controls the rate at which the model penalizes well-classified examples.
Why Does Gamma Matter?
Gamma essentially determines how much attention the model pays to hard examples. A low gamma (close to 0) treats all examples almost equally, like standard cross-entropy. A high gamma puts more focus on poorly predicted examples. Striking the right balance is key.
Choosing the Right Range for Gamma
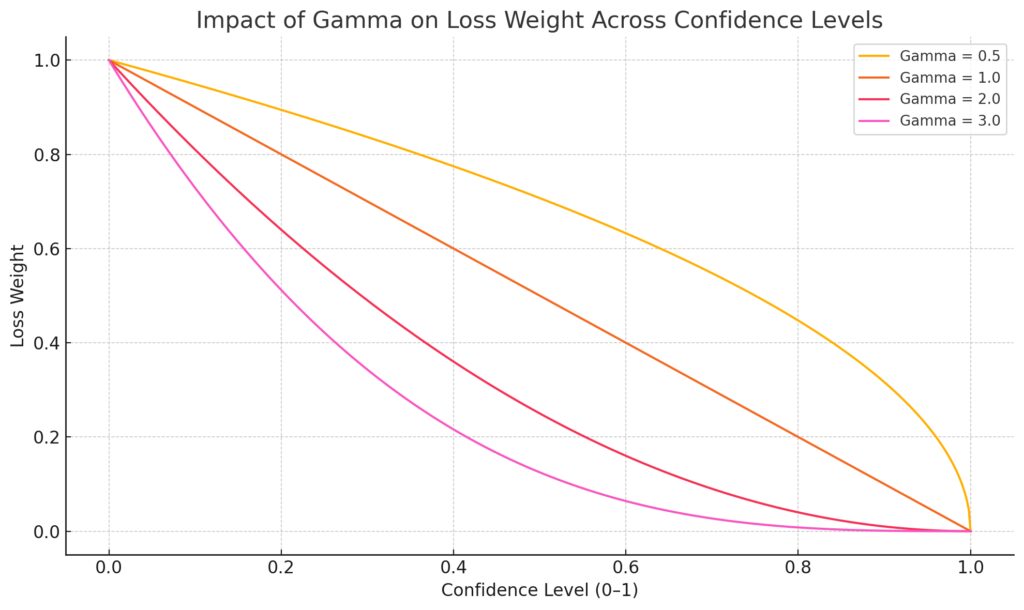
Y-Axis: Represents the loss weight applied to examples based on confidence.
Default Recommendations
When starting with Focal Loss, most research recommends gamma = 2.0, as in the original paper by Lin et al. However, this value isn’t universal.
For balanced datasets, lower values like gamma = 0.5 to 1.5 often perform better, ensuring the model doesn’t over-focus on hard examples.
For extreme imbalances, consider gamma = 2.5 or higher. It gives rare instances significantly more weight.
Domain-Specific Insights
Your dataset and task determine gamma’s effectiveness:
- Object detection: Values between 1.5 to 3 tend to work well.
- Medical imaging: Start with 1.0 to 2.0 for most segmentation tasks.
- Text classification: Use 0.5 to 1.5, especially with moderately imbalanced data.
Practical Steps for Tuning Gamma
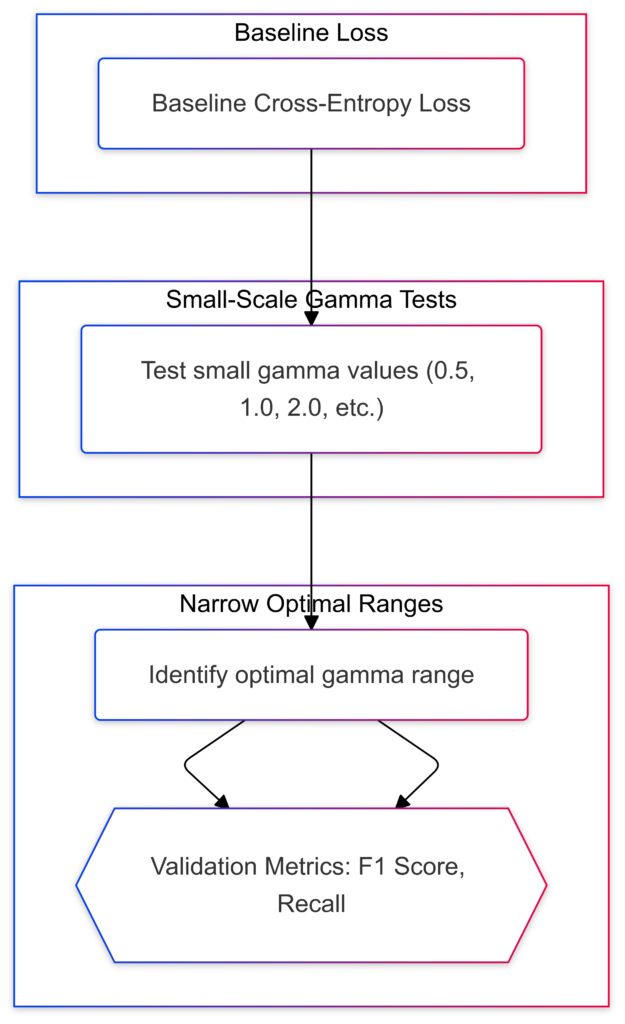
Workflow for tuning gamma to optimize model performance on imbalanced datasets.
Step 1: Baseline Performance
First, train your model using gamma = 0 (standard cross-entropy). Measure baseline metrics like precision, recall, and F1 score. This provides a reference point.
Step 2: Small Scale Testing
Test gamma values incrementally:
- Start with 0.5, 1.0, 1.5, and 2.0.
- Record results and compare improvements in metrics, particularly precision-recall curves.
Step 3: Narrow Down the Range
Once you identify a promising gamma range, fine-tune further with smaller increments (e.g., 0.1 or 0.2). Look for consistency across validation results.
Evaluating the Impact of Gamma Tuning
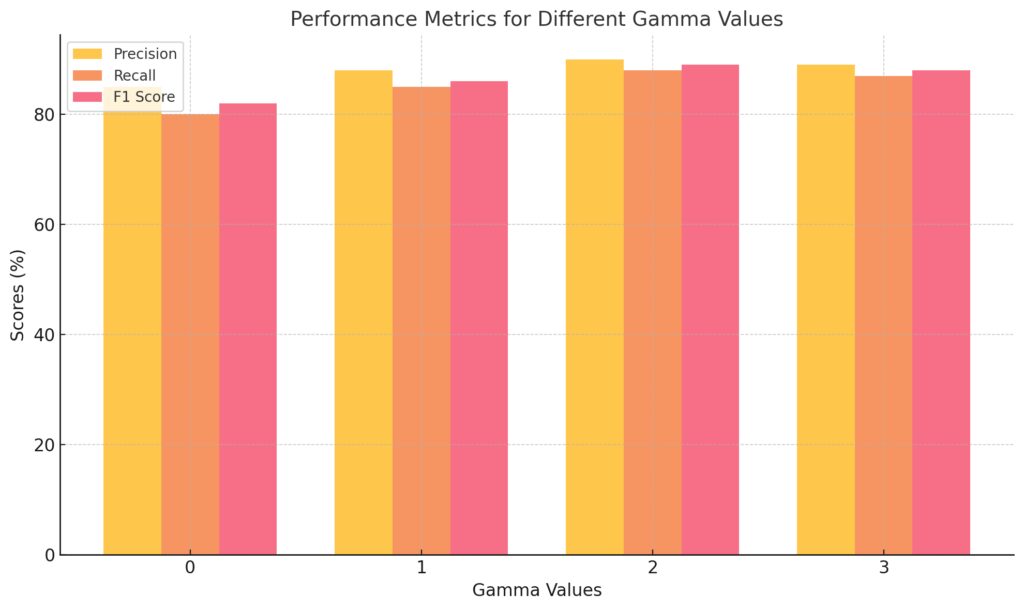
Precision: Indicates the percentage of correctly identified positives.
Recall: Measures the ability to find all relevant instances.
F1 Score: Balances precision and recall.
This chart demonstrates how different gamma values impact precision, recall, and F1 scores.
Key Metrics to Track
- Precision and Recall: These metrics highlight how effectively the model handles minority classes.
- F1 Score: Combines precision and recall, offering a balanced evaluation.
- Confusion Matrix: A great way to visualize improvements in minority class predictions.
Avoid Overfitting
Be wary of overfocusing on outliers. High gamma values can amplify noise in your data, leading to overfitting. Validate thoroughly!
Advanced Strategies for Gamma Tuning
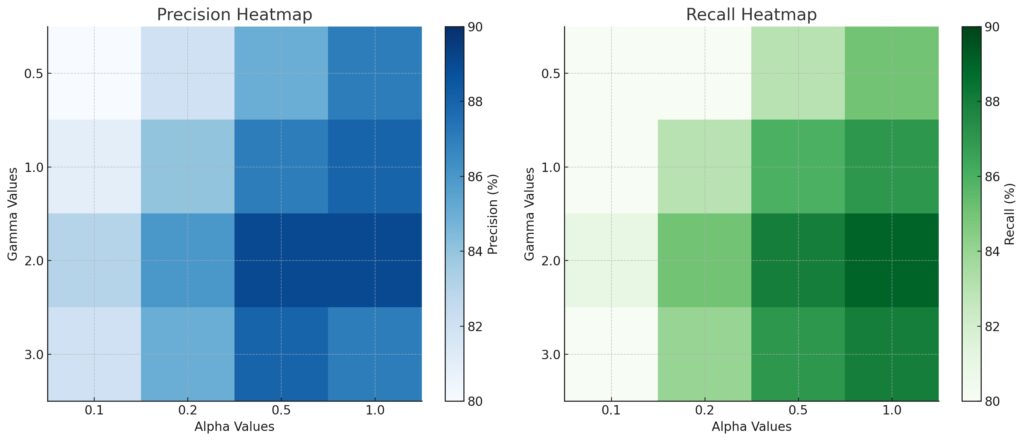
X-Axis: Alpha values (0.1, 0.2, 0.5, 1.0).
Y-Axis: Gamma values (0.5, 1.0, 2.0, 3.0).
Darker Blue: Indicates higher precision.
Recall Heatmap:
X-Axis: Alpha values (0.1, 0.2, 0.5, 1.0).
Y-Axis: Gamma values (0.5, 1.0, 2.0, 3.0).
Darker Green: Indicates higher recall.
Sweet Spot:
Look for the intersection of dark regions in both heatmaps, where both precision and recall are maximized.
Use Validation Curves
A practical way to refine gamma is by plotting validation curves. Train models with different gamma values and measure their performance on the validation set. Identify the sweet spot where improvements plateau or begin to decline.
Key points to evaluate:
- Performance for rare classes.
- Overall generalization gap between training and validation metrics.
Experiment with Adaptive Gamma
Instead of a fixed value, some researchers suggest adaptive gamma. This approach adjusts gamma dynamically based on the prediction confidence:
[math]γ=logit(pt)⋅k\gamma = \text{logit}(p_t) \cdot kγ=logit(pt)⋅k [/math]
Here, kkk is a scaling factor you can tune. Adaptive gamma can be beneficial when working with datasets with multi-level imbalance.
When to Combine Gamma with Alpha
Balancing Gamma with Alpha
Focal Loss also includes an alpha parameter, which addresses class imbalance by weighting classes differently. When tuning gamma, alpha should complement gamma:
- For highly imbalanced datasets, use both alpha and gamma together.
- For moderate imbalance, focus on tuning gamma first while keeping alpha fixed (e.g.,[math]α=0.25) [/math] .
Common Combinations
- Gamma = 2, Alpha = 0.25: Default setup for severe imbalance.
- Gamma = 1.0–1.5, Alpha = 0.5–0.75: Balanced performance for moderately imbalanced data.
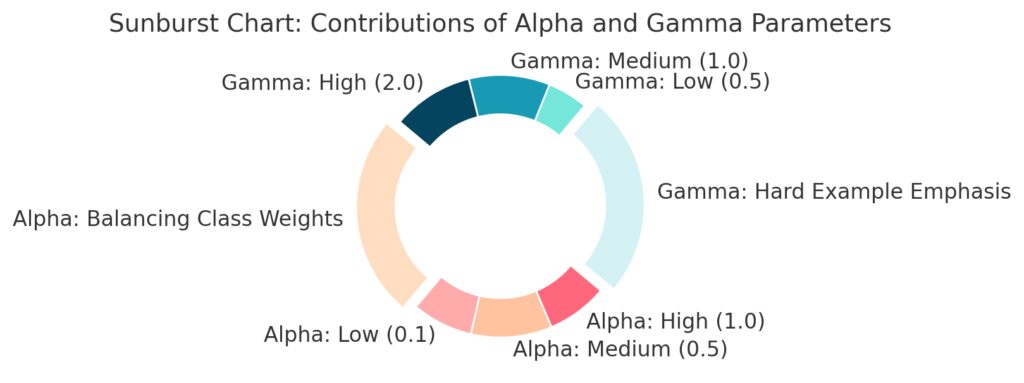
Gamma: Focuses on hard examples (50% contribution).
Outer Ring:Breaks down alpha and gamma contributions further:Alpha:Low (0.1): 15%
Medium (0.5): 20%
High (1.0): 15%
Gamma:Low (0.5): 10%
Medium (1.0): 20%
High (2.0): 20%.
Tools and Techniques for Gamma Optimization
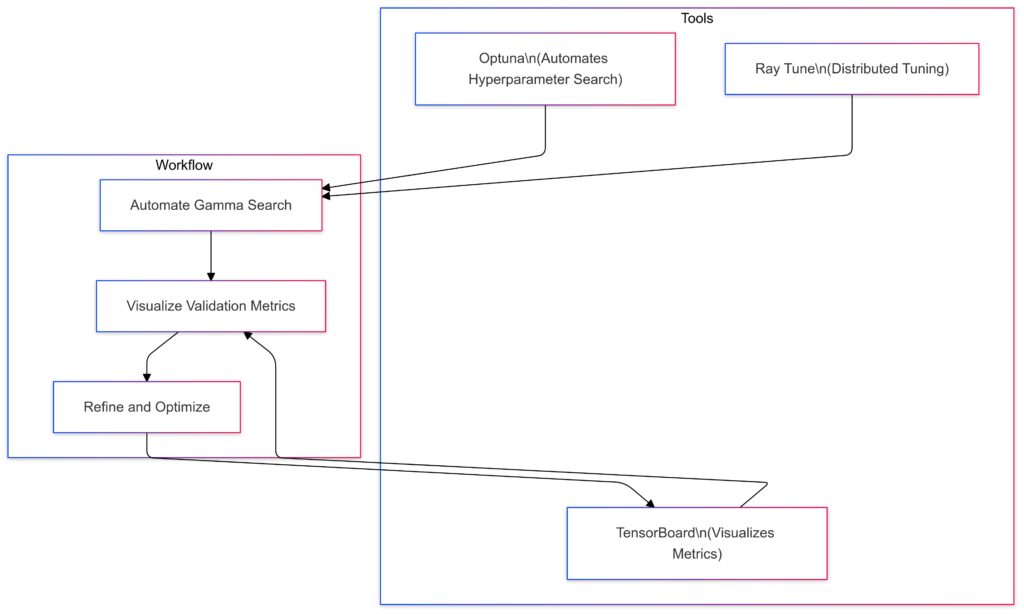
Optuna: Automates hyperparameter search for efficient tuning.
Ray Tune: Enables distributed tuning across multiple resources.
TensorBoard: Visualizes validation metrics for deeper insights.
Workflow:
Automate: Use Optuna and Ray Tune to search gamma values.
Visualize: Leverage TensorBoard for metric tracking.
Refine: Iteratively optimize gamma values based on insights.
Automated Hyperparameter Tuning
Manually testing gamma values can be time-consuming. Tools like Optuna, Ray Tune, or GridSearchCV can automate this process. Use these frameworks to test combinations of gamma, alpha, and learning rates simultaneously.
Visualization Tools
Leverage TensorBoard or similar tools to track loss curves and focus on how Focal Loss changes over epochs. Observe:
- How quickly the loss for rare classes decreases.
- Whether hard examples are receiving higher attention.
Final Tips for Successful Gamma Tuning
- Don’t neglect your baseline: Always measure gains against standard cross-entropy.
- Start simple: Begin with default gamma values (1.0 or 2.0) before diving into fine-tuning.
- Experiment incrementally: Small adjustments can make a big difference.
- Validate rigorously: Overfitting is a common pitfall when focusing too heavily on minority classes.
By systematically tuning the gamma parameter in Focal Loss, you can significantly improve your model’s ability to handle imbalanced datasets—without sacrificing overall performance.
FAQs
What is a good starting point for gamma?
A typical starting point is gamma = 2.0, as suggested in the original Focal Loss paper. For example, in object detection tasks like face detection in images, this default often provides robust results. If you’re dealing with moderately imbalanced data, you can start lower, around 1.0, and adjust based on your validation metrics.
How does gamma affect the focus on hard examples?
Gamma increases the penalty for hard-to-classify examples by amplifying their impact on the loss. For instance, in a dataset with rare cancer detection, setting gamma to 2.5 ensures the model focuses more on correctly predicting cancer cases, even if they are rare. Too high a gamma (e.g., 5.0) may overly penalize noise in the data, leading to overfitting.
Should gamma always be paired with alpha?
Not necessarily, but it’s often beneficial in highly imbalanced datasets. For example, in multi-class sentiment analysis where the positive class makes up only 5% of the data, using gamma = 2.0 with alpha = 0.25 ensures that both hard examples and the minority class are addressed effectively. In contrast, for datasets with minor imbalances, you can focus on tuning gamma alone.
Can gamma lead to overfitting?
Yes, high gamma values may overemphasize hard-to-predict examples, which might include outliers or mislabeled data. For instance, in an e-commerce fraud detection model, if gamma is set to 4.0, the model might focus too much on rare fraudulent transactions that are mislabeled, reducing generalization to real-world data.
What tools can help with gamma tuning?
You can use hyperparameter optimization tools like Optuna or Ray Tune to test gamma values systematically. For instance, you could define a search space between 0.5 and 3.0 and evaluate F1 scores for each trial. Visualization tools like TensorBoard can also help you monitor loss curves for rare classes during tuning.
How does gamma impact the training process?
Gamma affects the learning dynamics by controlling the focus on easy versus hard examples. For instance, in an image classification task with cats and dogs, a gamma of 0 (cross-entropy) treats all misclassifications equally. However, with gamma = 2.0, the model puts more weight on distinguishing rare breeds, like Sphynx cats, while reducing the impact of correctly classified examples like Labradors.
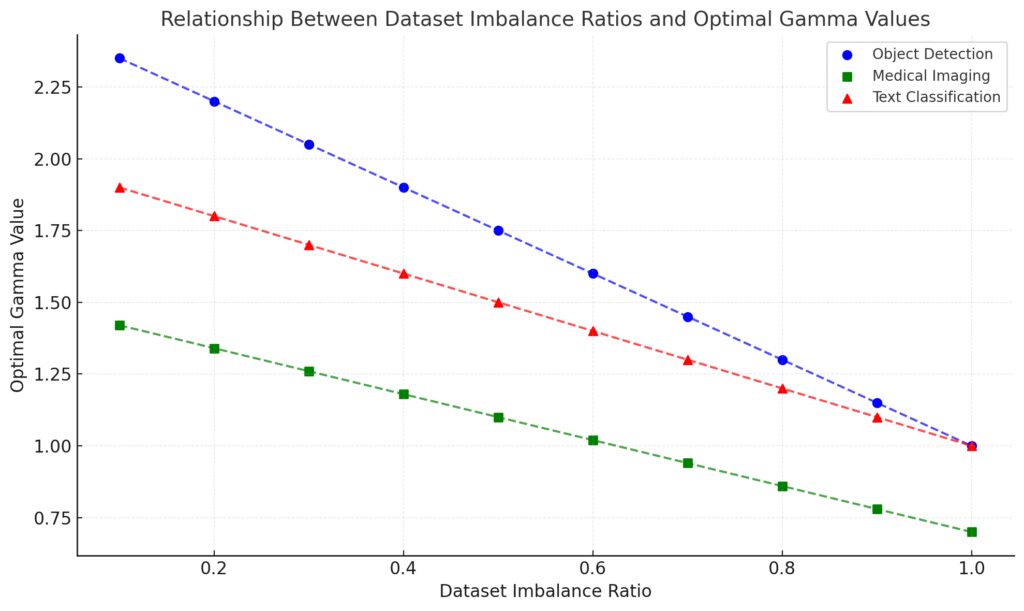
Y-Axis: Optimal gamma values.
Tasks:
Object Detection: Blue circles with a decreasing trend.
Medical Imaging: Green squares with a moderately decreasing trend.
Text Classification: Red triangles with a decreasing trend.
Trendlines: Show how optimal gamma values correlate with imbalance ratios for each task.
What if gamma is set too low?
A very low gamma (close to 0) makes Focal Loss behave like standard cross-entropy loss, offering little to no advantage for imbalanced datasets. For example, in medical imaging tasks where abnormalities are rare, setting gamma at 0.1 might lead the model to overemphasize common healthy cases, ignoring the minority abnormal ones.
Is there a rule of thumb for choosing gamma based on dataset imbalance?
A rough guideline is:
- For mild imbalances (e.g., 1:3 ratio), try gamma = 0.5 to 1.5.
- For severe imbalances (e.g., 1:10 ratio), start with gamma = 2.0 to 3.0.
For instance, in a financial fraud detection system where only 2% of transactions are fraudulent, a gamma of 2.5 ensures the model focuses on those rare fraudulent cases while down-weighting the easy, legitimate ones.
Does gamma need to be the same for all classes?
No, you can apply class-specific gamma values to balance focus across different classes. For example, in a multi-class classification problem with three classes (A, B, and C) where class C is the most underrepresented, you could use gamma = 2.5 for class C, and gamma = 1.0 for A and B.
This approach is particularly useful in multi-class segmentation tasks like annotating satellite images where some regions (e.g., forests) are rare compared to others (e.g., urban areas).
Can gamma improve performance in balanced datasets?
Gamma is not typically necessary for well-balanced datasets. In these cases, standard cross-entropy or other loss functions often suffice. For example, in a sports activity classifier with evenly distributed classes like running, swimming, and cycling, adding a high gamma might unnecessarily complicate learning.
What datasets benefit the most from gamma tuning?
Datasets with class imbalance or hard-to-classify examples benefit the most. Some common examples include:
- Medical Imaging: Detecting rare diseases in X-rays or CT scans.
- Object Detection: Identifying small or partially occluded objects.
- Fraud Detection: Spotting rare fraudulent transactions in large datasets.
- Wildlife Monitoring: Classifying rare animal species in camera trap images.
How do you validate the effectiveness of gamma?
To validate gamma’s impact, track metrics like precision, recall, and F1 score, particularly for minority classes. For example, in a rare event detection task, compare the model’s recall at gamma = 0 (cross-entropy) versus gamma = 2.0. If recall improves significantly without sacrificing precision, the gamma value is effective.
Can gamma be combined with other loss functions?
Yes, Focal Loss with gamma can be combined with other loss functions for specific scenarios. For instance:
- Use Dice Loss alongside Focal Loss in medical segmentation tasks to ensure both region consistency and focus on hard examples.
- Combine Focal Loss with a center loss in face recognition to balance classification accuracy and feature compactness.
How do you monitor training stability when using gamma?
When using high gamma values, monitor:
- Loss curves: Ensure they converge smoothly without oscillations.
- Validation performance: Watch for overfitting on hard examples.
- Training time: High gamma may slow down training, especially in large-scale datasets like COCO or ImageNet.
For example, a sudden increase in validation loss when using gamma > 3.0 could signal overfitting or improper balance in focus.
Resources for Tuning the Gamma Parameter in Focal Loss
Tuning gamma requires an understanding of the theory, practical experimentation, and access to tools. Below are some valuable resources to deepen your knowledge and streamline your workflow.
Foundational Papers and Articles
- Original Focal Loss Paper:
Lin, T.-Y., et al. (2017). “Focal Loss for Dense Object Detection”
Read the Paper
This paper introduces the concept of Focal Loss, including gamma and its use in object detection tasks. - Class Imbalance in Deep Learning:
Buda, M., Maki, A., & Mazurowski, M. (2018). “A systematic study of the class imbalance problem in convolutional neural networks”
Read the Paper
Explains strategies for dealing with imbalance and how loss functions like Focal Loss can help.
Tools for Hyperparameter Tuning
- Optuna:
An open-source hyperparameter optimization framework. You can use it to fine-tune gamma, alpha, and other parameters systematically.
Optuna Documentation - Ray Tune:
A scalable hyperparameter tuning library ideal for deep learning tasks.
Ray Tune Documentation - Scikit-Learn GridSearchCV:
Though not deep-learning-specific, it can be used for small-scale experiments with gamma values.
GridSearchCV Documentation
Practical Tutorials and Guides
- Focal Loss Implementation:
TensorFlow and PyTorch both offer prebuilt or custom Focal Loss implementations. Check out these tutorials:- TensorFlow: TensorFlow Addons: Focal Loss
- PyTorch: PyTorch Implementation of Focal Loss
- Hyperparameter Tuning in PyTorch:
Learn how to combine Focal Loss with tools like Ray Tune or manual grid search.
PyTorch Official Documentation
Visualization and Analysis Tools
- TensorBoard:
Essential for monitoring loss curves, precision, and recall metrics during gamma tuning.
TensorBoard Guide - Weights & Biases:
A great tool for tracking experiments, visualizing metrics, and collaborating with teams.
Weights & Biases Platform - Matplotlib and Seaborn:
For creating custom precision-recall curves and comparing gamma values.
Matplotlib
Seaborn
Online Communities and Forums
- Stack Overflow:
Search for issues related to Focal Loss implementation and gamma tuning.
Visit Stack Overflow - Kaggle Forums:
Join discussions on handling class imbalances and optimizing Focal Loss in competitions.
Visit Kaggle - Reddit – r/MachineLearning:
Share your gamma tuning experiences or find discussions about loss functions.
Visit r/MachineLearning
Pretrained Models for Experimentation
Hugging Face Models:
Offers a variety of pretrained models where you can experiment with Focal Loss for tasks like text classification or image segmentation.
Hugging Face Hub
Detectron2:
Facebook’s object detection framework supports Focal Loss and is pre-configured for experiments.
Detectron2 Documentation


