Discovering the Power of Statistical Methods for Anomaly Detection
Why Anomaly Detection Matters
In today’s data-driven world, anomaly detection plays a crucial role across multiple domains. Whether it’s in finance, cybersecurity, health monitoring, or industrial applications, identifying outliers can prevent potential disasters. But how do we find these anomalies? Let’s explore some effective statistical methods.
Understanding the Basics: What is Anomaly Detection?
At its core, anomaly detection involves pinpointing data points that deviate significantly from the norm. These anomalies can indicate errors, fraud, or unexpected behaviors. By leveraging statistical techniques, we can detect these anomalies accurately and efficiently.
The Power of Z-Score
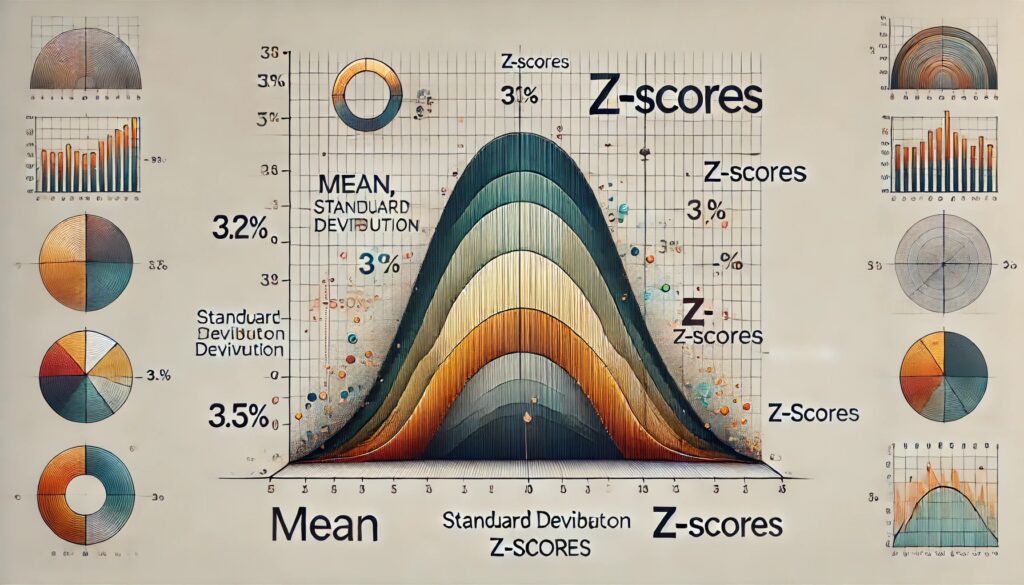
One of the most straightforward methods for anomaly detection is the Z-score. This technique measures how many standard deviations a data point is from the mean. A high Z-score indicates a potential anomaly. It’s a simple yet powerful way to highlight outliers in a dataset.
Moving Averages: Smooth and Detect
Moving averages help smooth out data to identify trends and anomalies. By calculating the average of data points within a specific window, this method can reveal deviations from the expected pattern. It’s especially useful in time-series data, where trends and patterns play a significant role.
Advanced Techniques: Beyond the Basics
While Z-scores and moving averages are effective, more advanced methods like Principal Component Analysis (PCA) and Isolation Forest offer deeper insights. PCA reduces data dimensionality, highlighting outliers in a simplified space. Isolation Forest, on the other hand, isolates anomalies by partitioning data points and measuring their isolation.
Practical Applications
In finance, anomaly detection helps spot fraudulent transactions. In cybersecurity, it identifies unusual network activity. Health monitoring systems use it to detect irregular patient vitals, while industrial applications rely on it to find equipment malfunctions. The versatility of these methods makes them indispensable tools in our data-centric world.
Z-Score: A Powerful Tool for Anomaly Detection
Overview
The Z-score, also known as the standard score, measures how many standard deviations a data point is from the mean of a dataset. The formula for calculating the Z-score is:

where:
- X is the value of the data point,
- μ is the mean of the dataset,
- σ is the standard deviation of the dataset.
The Z-score transforms the data point into a standardized form, enabling comparison across different datasets or identifying anomalies within the same dataset.
Application
Z-scores are extensively used in various fields to detect anomalies:
- Finance: Identifying unusual price movements or trading volumes.
- Healthcare: Detecting abnormal health metrics, such as unusually high blood pressure readings.
- Manufacturing: Spotting defects or outliers in quality control processes.
- Environmental Monitoring: Highlighting abnormal pollution levels.
Example
Consider a dataset of daily temperatures over a year, and we want to identify days with anomalous temperatures.
- Calculate the Mean and Standard Deviation: Suppose the mean temperature (μ) is 20°C, and the standard deviation (σ) is 5°C.
- Compute the Z-score for a specific day with a temperature of 30°C:

- Interpret the Z-score: A Z-score of 2 means the temperature is 2 standard deviations above the mean. Typically, Z-scores beyond ±3 are considered anomalies, depending on the context and required sensitivity.
Pros and Cons
Pros:
- Simplicity: Easy to compute and interpret.
- Standardization: Enables comparison across different datasets.
- Effective for Normally Distributed Data: Works well if the data follows a normal distribution.
Cons:
- Sensitivity to Outliers: Extreme values can skew the mean and standard deviation, affecting the Z-scores.
- Assumes Normal Distribution: The effectiveness diminishes if the data is not normally distributed.
- Fixed Thresholds: Requires choosing thresholds (like ±3), which may not be suitable for all datasets.
Practical Considerations
- Preprocessing: Data should be preprocessed to handle missing values and ensure consistency.
- Threshold Selection: Depending on the application, thresholds for defining anomalies might need adjustment.
- Combining with Other Methods: For better accuracy, Z-scores can be combined with other statistical or machine learning methods, especially in complex datasets.
Example Scenario: Detecting Anomalies in Sales Data
Imagine a retailer wants to detect anomalies in daily sales data over the past year. The steps are:
- Collect Data: Gather daily sales figures for the entire year.
- Calculate Mean and Standard Deviation: Compute the mean (μ) and standard deviation (σ) of the sales data.
- Compute Z-scores: For each day’s sales, calculate the Z-score using the formula.
- Identify Anomalies: Flag days where the Z-score exceeds ±3 as anomalies.
By using Z-scores, the retailer can identify days with unusually high or low sales, prompting further investigation into potential causes, such as marketing campaigns, holidays, or supply chain issues.
Delving Deeper into Z-Scores
How Z-Scores Work
Z-scores convert individual data points into a standardized format by expressing them in terms of standard deviations from the mean. This standardization allows for easier comparison across different datasets and helps in identifying outliers effectively.
Detailed Calculation
To calculate the Z-score for a given data point X, follow these steps:
- Find the Mean (μ): Add up all the data points and divide by the number of points.
- Calculate the Standard Deviation (σ): This involves finding the average distance of each data point from the mean.
- Apply the Z-score Formula:

Practical Examples
Finance: Identifying Unusual Trading Volumes
In finance, Z-scores are used to detect abnormal trading volumes. Suppose a stock usually trades around 1 million shares per day with a standard deviation of 200,000 shares. If one day, the trading volume jumps to 1.6 million shares:
- Mean (μ) = 1,000,000 shares
- Standard Deviation (σ) = 200,000 shares
- Trading Volume (X) = 1,600,000 shares

A Z-score of 3 indicates this volume is 3 standard deviations above the mean, marking it as a potential anomaly.
Healthcare: Monitoring Blood Pressure
In healthcare, Z-scores help in monitoring vital signs. Consider a patient whose normal systolic blood pressure is 120 mmHg with a standard deviation of 10 mmHg. If a reading shows 150 mmHg:
- Mean (μ) = 120 mmHg
- Standard Deviation (σ) = 10 mmHg
- Blood Pressure Reading (X) = 150 mmHg

A Z-score of 3 suggests a significant deviation from the norm, potentially indicating a health issue that needs attention.
Advantages of Using Z-Scores
- Standardization: Z-scores allow comparisons between different datasets, regardless of their original scales.
- Simplicity: The formula is straightforward, making it easy to compute and interpret.
- Detection of Outliers: Z-scores are effective in identifying outliers in normally distributed data.
Limitations and Challenges
- Sensitivity to Outliers: Extreme values can distort the mean and standard deviation, affecting the Z-scores.
- Assumption of Normal Distribution: Z-scores work best with normally distributed data. If the data is skewed, the results may not be as reliable.
- Threshold Setting: Choosing appropriate thresholds (like ±3) can be challenging and may require domain-specific adjustments.
Enhancing Z-Scores with Data Preprocessing
For accurate anomaly detection, it’s crucial to preprocess the data:
- Handle Missing Values: Ensure there are no gaps in the dataset that could skew the results.
- Remove Noise: Filter out irrelevant data points to improve the accuracy of Z-score calculations.
- Normalize Data: If the data is not normally distributed, consider transforming it to achieve a more normal distribution.
Combining Z-Scores with Other Methods
To enhance the accuracy and robustness of anomaly detection, combine Z-scores with other techniques:
- Machine Learning Algorithms: Use methods like clustering, decision trees, or neural networks to complement Z-score analysis.
- Hybrid Approaches: Combine statistical methods with rule-based systems to handle complex datasets and improve detection rates.
Real-World Application: Environmental Monitoring
In environmental monitoring, Z-scores help detect unusual pollution levels. For example, if daily CO2 levels in a city average 400 ppm with a standard deviation of 20 ppm, a sudden spike to 460 ppm would be analyzed as:
- Mean (μ) = 400 ppm
- Standard Deviation (σ) = 20 ppm
- CO2 Level (X) = 460 ppm

A Z-score of 3 highlights a significant increase, signaling potential environmental issues needing investigation.
Versatility and Applications of Z-Scores
Expanding Horizons with Z-Scores
The Z-score is a versatile tool that extends beyond basic anomaly detection. Its ability to standardize data makes it invaluable in various fields, facilitating deeper insights and more accurate analysis.
Diverse Applications of Z-Scores
Academic Performance
In education, Z-scores are used to compare students’ performance across different tests or subjects. For instance, if a student scores 85 on a math test with a mean of 75 and a standard deviation of 5:
- Mean (μ) = 75
- Standard Deviation (σ) = 5
- Test Score (X) = 85

A Z-score of 2 indicates the student scored 2 standard deviations above the mean, showcasing excellent performance relative to peers.
Standardizing Scores in Psychological Testing
Psychological assessments often use Z-scores to standardize test results, enabling comparison across different populations. For example, a depression inventory score can be transformed into a Z-score to see how an individual’s score compares to a normative sample.
Quality Control in Manufacturing
In manufacturing, Z-scores help maintain quality by identifying defective products. Suppose a factory produces widgets with a mean length of 10 cm and a standard deviation of 0.2 cm. A widget measuring 10.6 cm:
- Mean (μ) = 10 cm
- Standard Deviation (σ) = 0.2 cm
- Widget Length (X) = 10.6 cm

A Z-score of 3 suggests a significant deviation from the mean, indicating a potential defect.
Environmental Science
Environmental scientists use Z-scores to analyze data trends over time. For instance, monitoring river pollution levels where the mean concentration of a pollutant is 50 ppm with a standard deviation of 5 ppm. A sudden reading of 65 ppm:
- Mean (μ) = 50 ppm
- Standard Deviation (σ) = 5 ppm
- Pollutant Level (X) = 65 ppm

This Z-score signals a possible environmental incident requiring further investigation.
Sports Analytics
In sports, Z-scores evaluate player performance across different games and seasons. For example, if a basketball player’s average points per game is 20 with a standard deviation of 4, and they score 32 points in a game:
- Mean (μ) = 20 points
- Standard Deviation (σ) = 4 points
- Game Score (X) = 32 points

A Z-score of 3 highlights an exceptional performance.
Advanced Uses of Z-Scores
Genetic Research
In genetics, Z-scores help identify significant variations in gene expression. By comparing gene expression levels to a reference dataset, researchers can pinpoint genes that are significantly up or down-regulated, facilitating discoveries in disease research.
Marketing and Customer Segmentation
Marketers use Z-scores to segment customers based on purchasing behavior. For instance, analyzing the average purchase value across different customer segments can reveal high-value customers, enabling targeted marketing strategies.
Combining Z-Scores with Other Techniques
To enhance the reliability of anomaly detection and data analysis, Z-scores can be combined with other methods:
- Machine Learning: Algorithms like clustering and classification can be used alongside Z-scores to improve detection accuracy.
- Hybrid Statistical Methods: Combining Z-scores with techniques like moving averages or regression analysis provides a more comprehensive view.
Diverse Applications of Z-Scores and How They Can Benefit Your Field
Unveiling the Power of Z-Scores
Z-scores are more than just a statistical tool; they are a gateway to understanding and interpreting data across various domains. By converting raw data into a standardized form, Z-scores provide a consistent method to detect anomalies, compare results, and gain insights.
Key Applications
Finance: Risk Management and Fraud Detection
In the financial sector, Z-scores are crucial for assessing risk and detecting fraudulent activities. For instance, Z-scores can identify unusual trading volumes or price movements that may indicate market manipulation or insider trading. Investment firms use Z-scores to analyze the volatility of assets, helping them manage portfolios more effectively.
Example:
- Credit Risk Analysis: Z-scores help in evaluating the credit risk of borrowers by comparing their financial ratios to industry averages, identifying potential defaults.
Healthcare: Monitoring Patient Health
Healthcare professionals use Z-scores to track patient health metrics over time. This is particularly useful in pediatric growth charts, where children’s growth measurements are compared to standardized growth curves.
Example:
- Bone Density Analysis: Z-scores help in diagnosing osteoporosis by comparing an individual’s bone density to the average bone density of a healthy young adult.
Manufacturing: Ensuring Quality Control
In manufacturing, Z-scores are employed to maintain quality control. They help in identifying defective products by comparing their characteristics to the standard specifications.
Example:
- Process Control: Monitoring the Z-scores of production parameters (e.g., weight, dimensions) to ensure they stay within acceptable limits, thus maintaining product quality.
Environmental Science: Detecting Environmental Changes
Environmental scientists utilize Z-scores to monitor changes in environmental parameters such as temperature, pollution levels, and water quality. By comparing current readings to historical data, they can detect significant deviations that may indicate environmental hazards.
Example:
- Air Quality Monitoring: Z-scores help in identifying days with unusually high pollution levels, triggering alerts and potential public health advisories.
Sports Analytics: Enhancing Player Performance
In sports, Z-scores are used to evaluate and compare athletes’ performances. This helps in identifying exceptional performances and making strategic decisions based on data.
Example:
- Performance Benchmarking: Comparing players’ game statistics to league averages to identify standout performers and areas for improvement.
Education: Assessing Academic Achievement
Educators use Z-scores to assess and compare student performance across different subjects and tests. This standardization helps in identifying students who may need additional support or those who excel.
Example:
- Standardized Testing: Converting test scores into Z-scores to compare student performance across different schools and districts.
Advanced Applications
Genetic Research: Understanding Genetic Variations
In genetics, Z-scores are instrumental in identifying significant variations in gene expression. This aids in understanding the genetic basis of diseases and developing targeted treatments.
Example:
- Genome-Wide Association Studies (GWAS): Using Z-scores to identify genetic variants associated with diseases by comparing the frequency of variants in affected versus unaffected individuals.
Marketing and Customer Insights
Marketers use Z-scores to segment customers based on purchasing behavior and other metrics. This allows for more targeted marketing campaigns and improved customer retention strategies.
Example:
- Customer Segmentation: Analyzing purchase data to identify high-value customers and tailoring marketing strategies to their preferences.

Example Scenario: Detecting Anomalies in Sales Data
Step-by-Step Guide
Imagine a retailer wants to detect anomalies in daily sales data over the past year. Here’s how you can use Z-scores to identify unusual sales figures.
1. Collect Data
Gather daily sales figures for the entire year. Let’s assume the sales data for 365 days is available.
2. Calculate Mean and Standard Deviation
Compute the mean (μ) and standard deviation (σ) of the sales data.
Example Calculation:
Suppose the mean daily sales (μ) is 5000, and the standard deviation (σ) is 1500.
3. Compute Z-scores
For each day’s sales, calculate the Z-score using the formula:
[latexpage] \[ Z = \frac{(X – \mu)}{\sigma} \]
Where:
- X is the sales value for a particular day.
- μ\ is the mean sales value.
- σ\ is the standard deviation of the sales values.
Example Calculation:
If the sales for a specific day are 8000:

4. Identify Anomalies
Flag days where the Z-score exceeds ±3 as anomalies. These are the days with sales figures significantly higher or lower than the average, indicating potential issues or noteworthy events.
Example Interpretation:
- A Z-score of 2 means the sales on that day are 2 standard deviations above the mean.
- If another day has sales of $2000:

A Z-score of -2 means the sales on that day are 2 standard deviations below the mean.
Typically, Z-scores beyond ±3 are considered significant anomalies.
Pros and Cons of Using Z-Scores in Sales Data Analysis
Pros:
- Simplicity: Easy to compute and interpret.
- Standardization: Facilitates comparison across different datasets.
- Detection of Significant Deviations: Effectively highlights unusual data points.
Cons:
- Sensitivity to Outliers: Extreme values can distort the mean and standard deviation, affecting the accuracy of Z-scores.
- Assumes Normal Distribution: Z-scores are most effective with normally distributed data.
- Fixed Thresholds: The threshold of ±3 may not be suitable for all datasets.
Practical Considerations for Implementation
Data Preprocessing:
- Handle Missing Values: Ensure there are no gaps in the dataset that could skew the results.
- Remove Noise: Filter out irrelevant data points to improve the accuracy of Z-score calculations.
- Normalize Data: If the data is not normally distributed, consider transforming it to achieve a more normal distribution.
Threshold Selection:
- Adjust Thresholds: Depending on the application, the thresholds for defining anomalies might need adjustment. While ±3 is a common choice, it may not be suitable for all datasets.
Context-Specific Analysis:
- Tailor Analysis: Customize the Z-score analysis to fit the specific context and requirements of the field or application.
FAQ’s
- What is the Z-score and how is it calculated?
- Understanding the fundamental concept of the Z-score and the mathematical formula behind it is crucial.
- In what scenarios is the Z-score most effectively used for anomaly detection?
- Identifying the best applications for Z-score can help determine its suitability for specific datasets or industries.
- What are the key assumptions behind using Z-scores?
- Knowing the assumptions, such as the requirement for a normal distribution, helps in assessing the validity of using Z-scores.
- How do outliers affect the calculation and interpretation of Z-scores?
- Understanding the impact of extreme values on mean and standard deviation is essential for accurate anomaly detection.
- What are the appropriate thresholds for identifying anomalies using Z-scores?
- Determining suitable Z-score thresholds (e.g., ±3) for different contexts is important for effective anomaly detection.
- How can Z-scores be integrated with other anomaly detection methods?
- Exploring the combination of Z-scores with other statistical or machine learning techniques can enhance accuracy and reliability.
- What are the limitations of using Z-scores for anomaly detection?
- Identifying potential drawbacks and challenges helps in understanding when and where Z-scores may not be appropriate.
- How does data preprocessing impact Z-score calculations?
- Considering the effects of handling missing values, normalization, and other preprocessing steps is crucial for accurate results.
- What are the best practices for implementing Z-score based anomaly detection in real-world scenarios?
- Learning from case studies and practical examples can provide valuable insights into effective implementation.
Biggest Challenges in Using Z-Scores for Anomaly Detection
- Data Distribution Assumptions
- Z-scores assume a normal distribution of data. Many real-world datasets do not follow this distribution, leading to inaccurate anomaly detection.
- Impact of Outliers
- Outliers can skew the mean and standard deviation, leading to distorted Z-scores. This can result in both false positives and false negatives.
- Threshold Determination
- Setting appropriate Z-score thresholds for identifying anomalies is subjective and context-dependent. Inappropriate thresholds can either miss anomalies or flag too many false positives.
- Scalability and Performance
- For large datasets, calculating Z-scores in real-time can be computationally intensive. Optimizing performance while maintaining accuracy is a challenge.
- Data Preprocessing Requirements
- Handling missing values, normalization, and other preprocessing steps are essential but can be complex and time-consuming.
- Interpretation of Results
- Understanding and interpreting Z-scores in the context of the specific application requires domain knowledge. Misinterpretation can lead to incorrect conclusions.
- Combination with Other Methods
- Integrating Z-scores with other anomaly detection methods requires careful consideration of compatibility and complementarity. Ensuring seamless integration can be challenging.
- Dynamic Data and Non-Stationarity
- In environments where data characteristics change over time (non-stationarity), Z-scores calculated on historical data may not be valid for future data.
- Balancing Sensitivity and Specificity
- Achieving a balance between sensitivity (correctly identifying true anomalies) and specificity (minimizing false positives) is often difficult.
- Handling Multivariate Data
- Extending Z-score analysis to multivariate data involves calculating multivariate means and covariances, which can be complex and computationally demanding.
Conclusion
Incorporating Z-scores into your data analysis toolkit can significantly enhance your ability to detect anomalies, standardize data, and derive meaningful insights. By following the implementation steps outlined above, you can leverage Z-scores to transform your approach to data analysis and decision-making.
