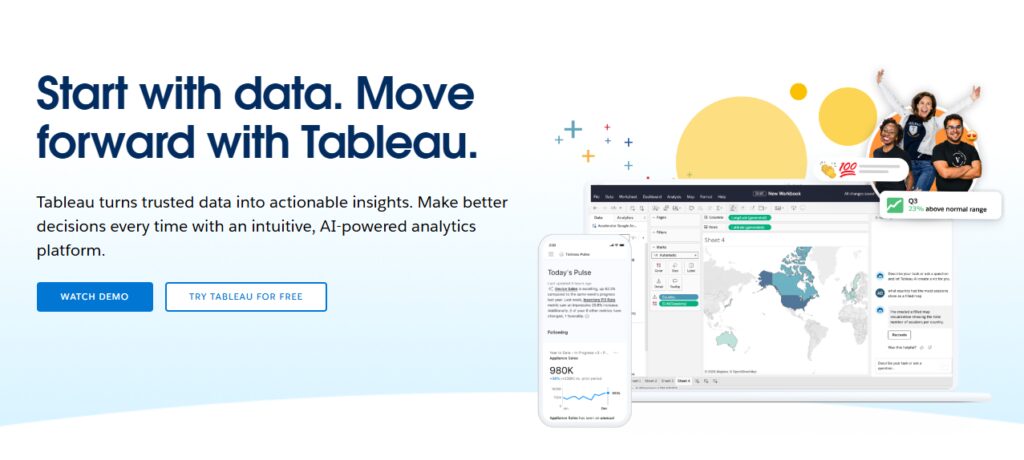
AI Meets Data: Dynamic Dashboards with Tableau and Power BI
The Power of Modern Dashboards
In today’s fast-paced business world, dashboards have become essential tools. They provide a visual representation of data, making it easier to understand complex information at a glance. But what if these dashboards could do more than just display data? What if they could predict future trends and help make real-time decisions? This is where integrating AI models into dashboards comes into play.
The Role of AI in Dashboards
Integrating AI into dashboards transforms them from static displays into dynamic, interactive tools. With AI, dashboards can perform predictive analytics, giving businesses foresight into trends and helping them make informed decisions. This combination of data visualization and AI offers a powerful tool for enhancing business intelligence.
Understanding AI-Powered Dashboards
Defining AI-Powered Dashboards
An AI-powered dashboard is a dynamic and interactive tool that not only displays data but also leverages artificial intelligence to provide predictive analytics and real-time insights. Unlike traditional dashboards that merely present historical data, AI-powered dashboards analyze trends, make forecasts, and offer actionable recommendations. This transformation allows businesses to not only view what has happened but also predict what is likely to happen and make proactive decisions accordingly.
Capabilities of AI-Enhanced Visualization Tools
Combining AI with visualization tools unlocks a myriad of capabilities. Predictive analytics enables forecasting future trends based on historical data. Real-time data processing allows dashboards to update and reflect changes as they occur, facilitating instant decision-making. AI models can also identify patterns and anomalies that might be overlooked by human analysis. These enhanced capabilities ensure that businesses gain deeper insights and more precise foresight, driving better strategic decisions.
Choosing the Right Tools
Tableau vs. Power BI: AI Integration Capabilities
When it comes to integrating AI with visualization tools, both Tableau and Power BI offer robust solutions, each with its own strengths. Tableau excels in its powerful and flexible data visualization capabilities, making it a favorite for creating complex and interactive dashboards. It supports integration with various AI tools and platforms, including Python and R, which are commonly used for machine learning.

On the other hand, Power BI is known for its seamless integration with Microsoft’s ecosystem, particularly Azure Machine Learning. Power BI’s strength lies in its ability to handle large datasets and its user-friendly interface, making it accessible for users with varying levels of technical expertise. Additionally, Power BI’s built-in AI features, such as automated machine learning and natural language processing, make it a versatile tool for businesses looking to leverage AI without extensive coding.

Choosing the Right Tool
Selecting the right tool depends on the specific needs of your business or data analytics tasks. If your focus is on deep and complex data visualizations with flexibility in design, Tableau might be the better choice. However, if you are looking for ease of integration with other Microsoft tools and a user-friendly approach to AI, Power BI could be more suitable. Assess your requirements in terms of data volume, desired AI capabilities, and the technical expertise of your team to make an informed decision.
Preparing Your Data
Tips for Data Collection and Preparation
The foundation of any successful AI-powered dashboard is high-quality data. Begin by collecting relevant data that aligns with your business objectives. Ensure that the data is comprehensive, covering all necessary aspects that will contribute to meaningful insights. Use tools like Power Query in Power BI or Tableau Prep to streamline the data collection process.
Importance of Data Quality and Cleaning
Data quality is paramount for the accuracy of AI predictions. Clean your data to remove duplicates, correct errors, and fill in missing values. This process, known as data cleaning, ensures that your AI models receive accurate and reliable information. Poor data quality can lead to incorrect predictions and misguided decisions, so it’s crucial to invest time in this preparatory step. Regularly update your data and maintain rigorous standards to keep your AI-powered dashboards effective and trustworthy.

Integrating AI with Tableau
Step-by-Step Tutorial
Connecting to AI Models
To connect Tableau to various AI models, you can utilize built-in integrations or custom scripts. Start by selecting the appropriate data source, such as a database or a cloud service. Use Tableau’s integration with Python or R to connect to your AI models. You can do this through the TabPy (Tableau Python Server) or R integration, allowing you to run scripts directly from Tableau. This integration facilitates seamless interaction between your data visualizations and AI-generated insights.
Creating a Dashboard
Setting up a dashboard in Tableau that feeds data from AI models involves several steps. First, import your data into Tableau. Next, apply the necessary AI model scripts using the calculated fields feature. This enables Tableau to process and visualize the AI-driven data. Design your dashboard by dragging and dropping the relevant data fields onto the worksheet. Customize the dashboard layout to highlight the most important AI insights, ensuring clarity and ease of understanding.
Visualization Tips
When visualizing AI-generated insights in Tableau, follow best practices to enhance readability and impact. Use clear and concise labels to describe AI predictions. Implement color coding to differentiate between various data points and trends. Interactive elements, such as filters and tooltips, allow users to explore the data in more detail. Ensure that the dashboard is not cluttered, focusing on the most significant insights derived from the AI model.
Integrating AI with Power BI
Step-by-Step Tutorial
Connecting to AI Models
Integrating Power BI with machine learning models can be efficiently done via Azure Machine Learning or other platforms. Start by setting up your machine learning model in Azure. Once the model is deployed, navigate to Power BI and select the Azure Machine Learning dataset as your data source. This connection allows Power BI to pull in predictions and insights generated by your AI model, seamlessly integrating them into your reports and dashboards.
Automating Data Flows
Power BI’s dataflows feature is a powerful tool for automating data ingestion and preparation for AI. Create a dataflow to define the data extraction and transformation process. This includes connecting to your data sources, cleaning the data, and structuring it for AI model consumption. Dataflows ensure that your data is always up-to-date, providing a steady stream of fresh information for your AI models to analyze.
Creating Dynamic Visuals
Building interactive visuals that update in real-time based on AI insights is crucial for maintaining an effective Power BI dashboard. Use the visualizations pane to select and customize various charts and graphs. Leverage Power BI’s interactive features, such as slicers and drill-throughs, to allow users to dive deeper into the data. Ensure that your visuals dynamically reflect the latest AI predictions, providing real-time insights that drive informed decision-making.
Advanced Features and Customization
Enhancing AI Capabilities with Python or R
Both Tableau and Power BI offer advanced functionalities by integrating Python or R scripts. In Tableau, you can use TabPy or RServe to run scripts that enhance your AI models’ capabilities. These scripts can perform complex calculations, data manipulations, and even run machine learning algorithms directly within Tableau. Similarly, Power BI allows the integration of Python and R scripts through the Power BI Desktop interface, enabling advanced data analysis and visualization.
Using APIs for Real-Time Predictions
APIs are essential for pulling real-time predictions from external AI services. In both Tableau and Power BI, you can set up API connections to fetch live data and predictions from AI models hosted on platforms like AWS, Google Cloud, or Azure. This real-time data integration ensures that your dashboards always display the most current insights, enabling prompt and accurate decision-making based on the latest information.
By leveraging these advanced features and customizations, businesses can significantly enhance their AI-powered dashboards, gaining deeper insights and achieving more precise predictions.
Best Practices for AI Dashboards
Maintaining and Updating AI Models and Dashboards
To ensure that your AI-powered dashboards remain effective, it’s crucial to regularly maintain and update both the AI models and the dashboards themselves. Continuously monitor the performance of your AI models, retraining them as new data becomes available to maintain predictive accuracy. Schedule periodic reviews to update the dashboard with new features and insights that align with evolving business goals. This proactive approach keeps your dashboards relevant and valuable over time.
Ensuring Data Security and Compliance
When integrating AI into dashboards, ensuring data security and compliance with regulations is paramount. Implement robust encryption methods to protect data in transit and at rest. Use authentication and access controls to restrict data access to authorized users only. Additionally, stay informed about data privacy laws and regulations relevant to your industry, such as GDPR or CCPA, and ensure your data practices are compliant to avoid legal repercussions.
Real-World Examples
Case Studies of Successful Implementations
Several companies have successfully implemented AI-powered dashboards to drive significant business improvements. For example, a retail chain used AI-enhanced dashboards to optimize inventory management. By predicting demand patterns, they reduced overstock and stockouts, resulting in cost savings and improved customer satisfaction. Similarly, a healthcare provider integrated AI with their dashboards to predict patient admission rates, enabling better resource allocation and reduced wait times.
Business Impact and Operational Improvements
The business impact of implementing AI-powered dashboards can be profound. Companies often experience improved decision-making capabilities, more efficient operations, and increased competitive advantage. By providing actionable insights and enabling real-time data-driven decisions, AI dashboards help businesses respond swiftly to market changes, optimize processes, and ultimately enhance profitability.
Conclusion
Building AI-powered dashboards is a game-changer for modern businesses. By integrating AI models with visualization tools like Tableau and Power BI, companies can transform static data displays into dynamic, insightful, and predictive tools. The key steps involve selecting the right tools, preparing high-quality data, and leveraging AI to enhance data analysis capabilities. The benefits are clear: improved decision-making, operational efficiency, and competitive advantage. Businesses are encouraged to experiment with different tools and techniques to find what best suits their needs, ensuring continuous improvement and adaptation to ever-evolving market demands.
FAQ: AI-Powered Dashboards with Tableau and Power BI
What are AI-powered dashboards?
AI-powered dashboards are dynamic tools that combine data visualization with artificial intelligence. Unlike traditional dashboards that display historical data, AI-powered dashboards use machine learning models to predict future trends and provide real-time insights, helping businesses make more informed decisions.
How do AI-powered dashboards differ from traditional dashboards?
AI-powered dashboards go beyond simply presenting past data. They integrate AI to perform predictive analytics, detect patterns, and offer actionable insights in real-time. This makes them more interactive and insightful compared to traditional dashboards.
Why should I integrate AI with my dashboards?
Integrating AI with dashboards enhances their capabilities by providing predictive insights and real-time data analysis. This helps businesses stay ahead of trends, optimize operations, and make data-driven decisions quickly.
Which tool is better for AI integration: Tableau or Power BI?
Both Tableau and Power BI offer robust AI integration capabilities, but they have different strengths. Tableau is known for its powerful data visualization and flexibility, while Power BI excels in data integration, ease of use, and seamless integration with Microsoft’s ecosystem, including Azure Machine Learning.
How do I connect Tableau to AI models?
To connect Tableau to AI models, you can use built-in integrations like TabPy (Tableau Python Server) or R integration. These allow you to run Python or R scripts within Tableau, enabling the use of machine learning models to enhance your data visualizations.
How do I integrate AI models with Power BI?
Power BI integrates with AI models through Azure Machine Learning and other platforms. You can connect Power BI to these models by selecting the Azure Machine Learning dataset as your data source, allowing Power BI to pull in AI-generated predictions and insights.
What are some best practices for maintaining AI-powered dashboards?
Regularly update your AI models with new data to maintain predictive accuracy. Ensure your dashboards are updated with the latest features and insights. Also, prioritize data security by using robust encryption, authentication, and compliance with data privacy regulations.
Can you provide examples of companies using AI-powered dashboards?
A retail chain optimized its inventory management using AI-enhanced dashboards, reducing overstock and stockouts. A healthcare provider predicted patient admission rates with AI, improving resource allocation and reducing wait times. These examples highlight the operational improvements and business impact of AI-powered dashboards.
How can I ensure data security and compliance in AI-powered dashboards?
Implement robust encryption for data in transit and at rest. Use authentication and access controls to restrict data access. Stay informed about relevant data privacy laws, such as GDPR and CCPA, and ensure your data practices comply with these regulations.
Where can I learn more about AI, Tableau, and Power BI?
Here are some valuable online resources
Resources
For those looking to dive deeper into AI, Tableau, and Power BI, here are some valuable online resources:
- Coursera: AI For Everyone – A beginner-friendly course that provides an overview of AI concepts and applications.
- edX: Data Science and Machine Learning Essentials – Learn the basics of data science and machine learning using Microsoft’s tools.
- Udemy: Tableau 2020 A-Z: Hands-On Tableau Training for Data Science – Comprehensive training on using Tableau for data visualization.
- Microsoft Learn: Introduction to Power BI – Free modules to get started with Power BI.
- Kaggle: Learn Python – Python tutorials that are essential for integrating AI into your dashboards.
- Tableau Community Forums – A great place to ask questions and share knowledge about Tableau.
- Power BI Community Forums – Engage with other Power BI users and experts.
By leveraging these resources, you can further enhance your skills and knowledge, enabling you to create powerful, AI-driven dashboards that drive business success.