
Creating a share price prediction model combines data science with finance, using historical and technical data to estimate future prices.
This guide walks you through the process of building a share price prediction model, from data collection to model training and evaluation.
Understanding Share Price Prediction
What Is Share Price Prediction?
Share price prediction refers to the process of forecasting the future price of a stock based on historical data, technical indicators, and sometimes even economic events or news sentiment. While predictions can never be 100% accurate, models that incorporate meaningful data and relevant indicators can provide insights that make predictions more reliable.
Why Share Price Prediction Is Useful
Accurate predictions can improve investment decisions, allow for algorithmic trading, and help companies, investors, and analysts assess market trends. Predictive models are especially useful in short-term trading strategies, where fast, data-driven decisions are crucial.
Step 1: Collecting and Preparing Data
Gathering Historical Stock Data
The first step is to gather historical data for the stock you’re predicting. This data generally includes:
- Open, High, Low, and Close (OHLC) prices: These represent the day’s opening and closing prices, as well as the highest and lowest prices recorded.
- Volume of trades: Indicates how many shares were traded during a certain period.
- Technical indicators: Moving averages, relative strength index (RSI), moving average convergence divergence (MACD), and others can provide insight into price trends.
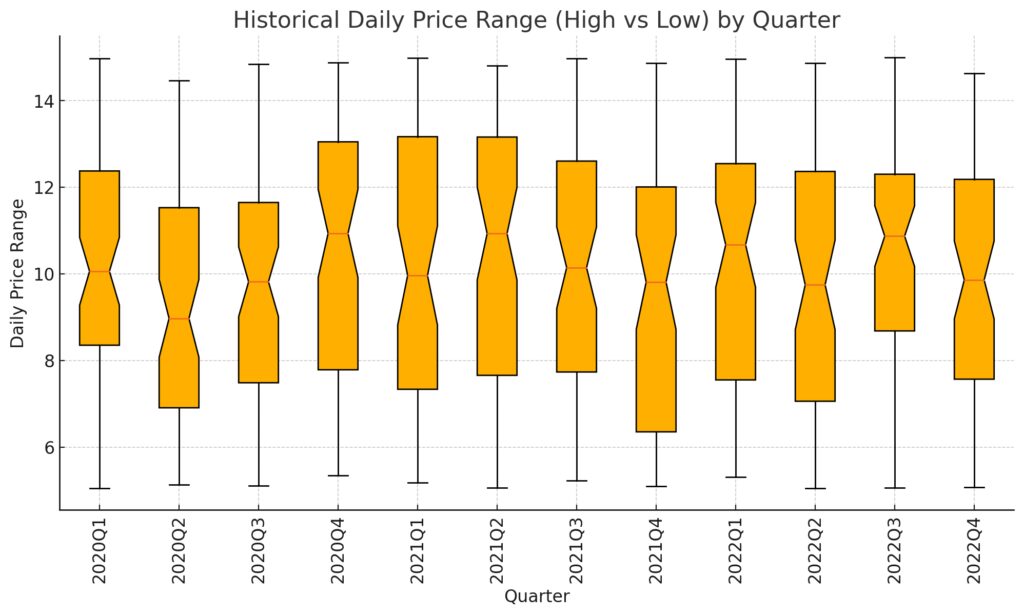
X-axis: Represents each quarter from 2020 to 2022.
Y-axis: Shows the daily price range (difference between daily high and low prices).
Box Plot Details: Each box shows the median, quartiles, and any outliers for the daily price range within each quarter.
This visualization provides insights into the stock’s price volatility across different quarters, highlighting fluctuations in trading range over time.
Platforms like Yahoo Finance, Alpha Vantage, and Quandl provide APIs to access historical stock data, which you can download and analyze in CSV format or directly into a Python DataFrame.
Cleaning and Organizing the Data
Stock data often has missing values, outliers, and other issues that need cleaning. Steps to clean your dataset include:
- Remove missing values: Drop rows with missing data or use imputation methods to fill in gaps.
- Remove outliers: Outliers can distort predictions, so removing or capping extreme values can improve accuracy.
- Convert dates to the right format: Ensure all dates are in chronological order and follow a consistent format.
- Standardize or normalize the data, especially if using machine learning models. Standardizing makes all features have a mean of zero and a standard deviation of one, making it easier for the model to learn relationships between variables.
Feature Engineering
Feature engineering helps the model capture complex patterns in data. For stock price prediction, useful features may include:
- Moving Averages: Simple moving averages (e.g., 5-day, 20-day) show average prices over specific periods and indicate trends.
- Bollinger Bands: Measure price volatility around a moving average and show when a stock might be overbought or oversold.
- Momentum Indicators: Capture the speed of price changes, indicating whether momentum is building or fading.
- Lagged Returns: Lagged daily or weekly returns capture how past price movements might impact future prices.
These features enrich the dataset and provide the model with insights into trends and volatility.
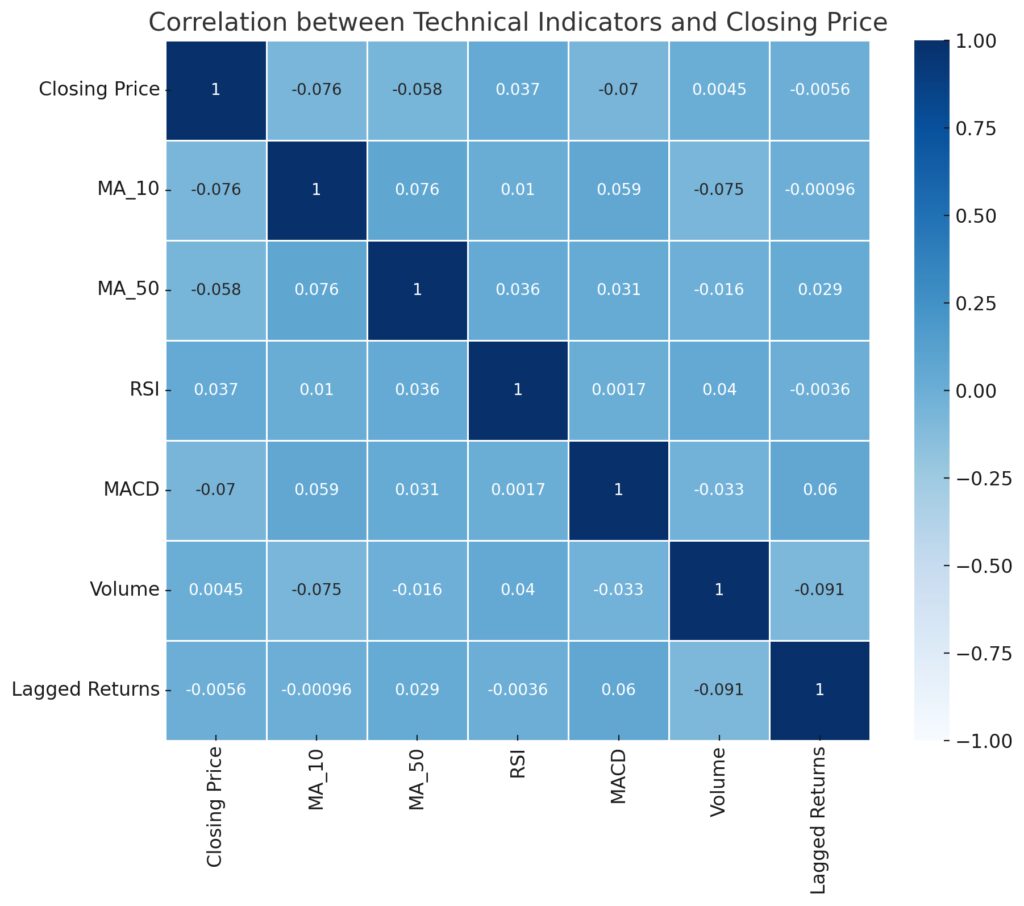
Indicators: Includes moving averages (MA_10, MA_50), RSI, MACD, Volume, and Lagged Returns.
Color Gradient: Darker shades indicate stronger correlations, with positive and negative values showing correlation strength and direction.
Step 2: Selecting a Modeling Approach

Choosing the Right Model
Several modeling approaches are available for stock price prediction:
- Statistical Time Series Models: ARIMA, SARIMA, and Exponential Smoothing are common for time series forecasting. They are simple but may be limited in capturing complex relationships.
- Machine Learning Models: Models like linear regression, support vector machines (SVM), or decision trees can capture nonlinear relationships but may struggle with sequential dependencies.
- Deep Learning Models: Long Short-Term Memory (LSTM) networks and Recurrent Neural Networks (RNN) are designed for sequential data and are effective in capturing trends over time.
For daily predictions, LSTMs are a popular choice because they retain information across multiple time steps.
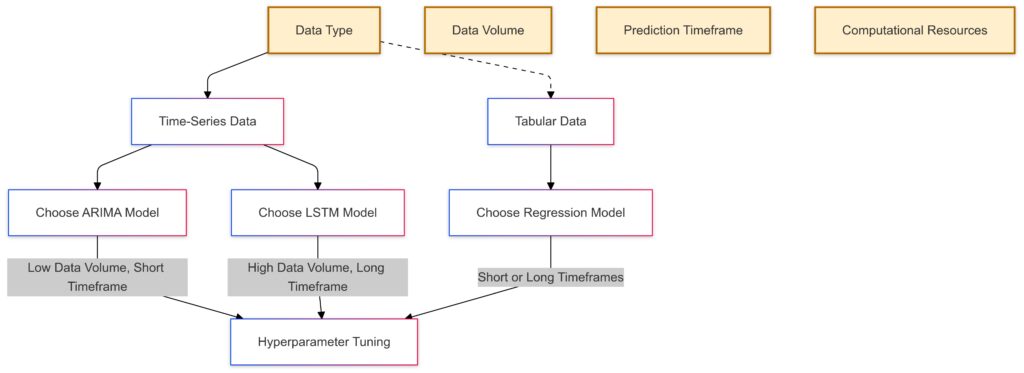
Data Type: Starts with identifying data as time-series or tabular.
Model Choices:Time-Series Data:ARIMA: Chosen for low data volume and short prediction timeframes.
LSTM: Selected for high data volume and long prediction timeframes.
Tabular Data:Regression: Suitable for both short and long timeframes.
Hyperparameter Tuning: Final stage to optimize the chosen model based on data characteristics.
Setting Up Your Environment
To develop and run the model, you need a coding environment with relevant libraries. Python is commonly used for stock prediction, with libraries such as:
- NumPy and pandas: For data manipulation and analysis
- Scikit-learn: For machine learning algorithms and evaluation metrics
- TensorFlow and Keras: For building and training deep learning models
A Jupyter Notebook or any IDE, such as PyCharm or VS Code, can be used to code interactively and visualize results.
Step 3: Training and Testing the Model
Splitting the Data
Divide your data into training and test sets. A typical split is 80% for training and 20% for testing. This split ensures that the model learns on one part of the data but is validated on unseen data, which simulates real-world predictions.
For example:
- Training Set: Used to train the model and capture relationships between features and target variable (stock price).
- Test Set: Used to evaluate model accuracy and performance on unseen data.
Training the Model
Use the training data to fit the model. The specific training process depends on the model chosen:
- Linear Regression and ARIMA: Fit the model directly on features and target prices.
- LSTM: Sequential data needs to be reshaped to 3D (samples, time steps, features) format. LSTMs use backpropagation through time to adjust weights based on prediction errors.
Adjust hyperparameters such as learning rate, epochs, and hidden layers (for neural networks) to improve accuracy. Libraries like Scikit-learn (for machine learning) and Keras (for deep learning) allow for quick model training and optimization.
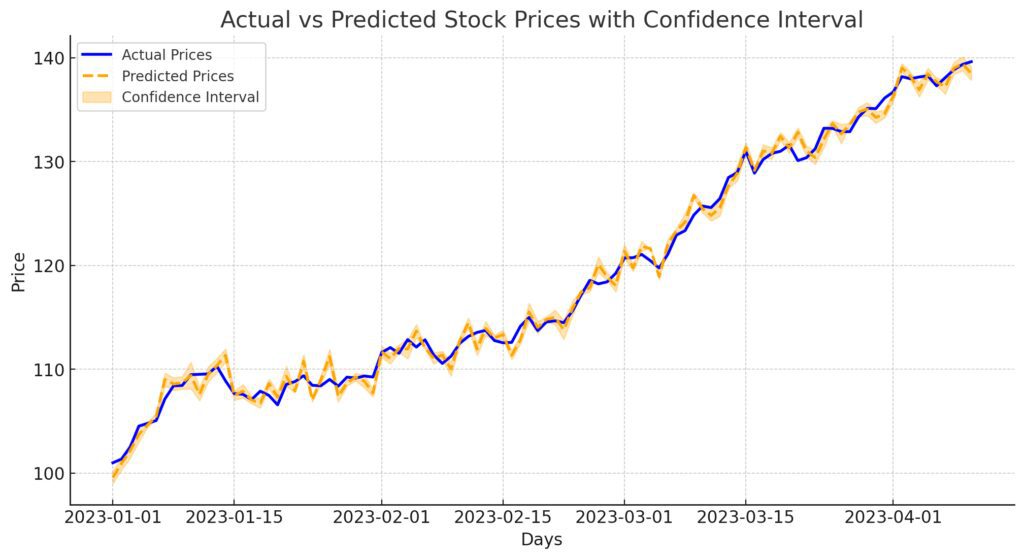
Blue Line: Actual stock prices.
Orange Dashed Line: Predicted stock prices.
Shaded Area: Confidence interval for predictions, illustrating the range of likely values.
Evaluating Model Performance
Evaluate model accuracy using metrics like:
- Mean Squared Error (MSE): Measures average squared difference between actual and predicted values.
- Root Mean Squared Error (RMSE): Square root of MSE, giving an indication of the absolute error size.
- Mean Absolute Error (MAE): Average of absolute errors between predicted and actual values.
Low MSE, RMSE, and MAE indicate a good fit. Evaluate how well the model generalizes by testing it on unseen data.
Step 4: Fine-Tuning and Optimizing the Model

Hyperparameter Tuning
Tuning hyperparameters can optimize model performance. For instance:
- LSTM-specific parameters: Layers, number of neurons, batch size, and sequence length can all affect how well the model learns patterns.
- Regularization: Techniques like L2 regularization reduce overfitting, especially useful for complex models like neural networks.
- Early Stopping: Stops training when the model’s performance no longer improves, helping to prevent overfitting.
Use grid search or random search for systematic hyperparameter tuning. Libraries like Scikit-learn and Keras Tuner offer tools for automated tuning.
Cross-Validation
Cross-validation, especially k-fold cross-validation, helps check how well the model generalizes. With k-fold, the data is split into k subsets, and the model is trained and validated k times, each time using a different subset for validation. Cross-validation can reduce the risk of overfitting and make the model more robust.
Avoiding Overfitting
Overfitting can cause a model to perform well on training data but poorly on new data. Techniques like:
- Dropout layers: In neural networks, dropout randomly removes nodes during training, forcing the network to learn general patterns.
- Regularization: Penalizes large weights to reduce model complexity.
These methods help the model generalize and maintain performance on unseen data.
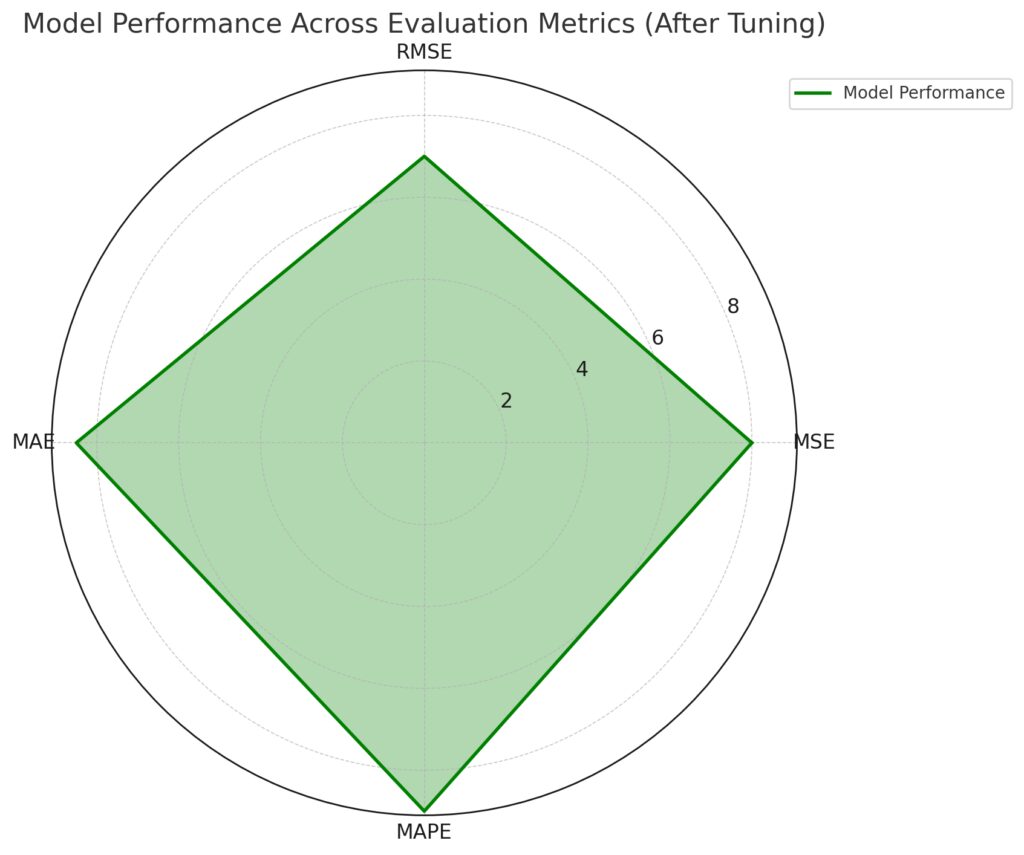
Model performance across evaluation metrics after tuning:
Performance Scores: Higher values indicate better performance, with this model scoring consistently across the metrics, particularly excelling in MAPE.
Metrics: Includes Mean Squared Error (MSE), Root Mean Squared Error (RMSE), Mean Absolute Error (MAE), and Mean Absolute Percentage Error (MAPE).
Step 5: Making Predictions
Testing Predictions on New Data
Once the model is optimized, use it to predict stock prices on a test dataset or new data. Observe how accurately it predicts future prices. Fine-tune further if the predictions are inaccurate or if the model overreacts to small data fluctuations.
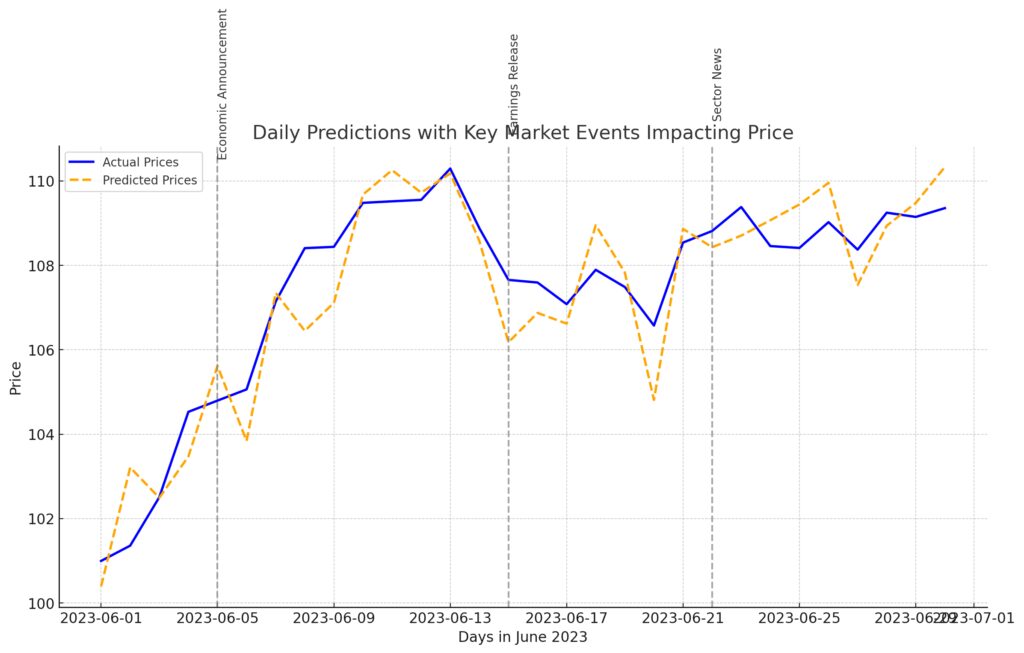
Orange Dashed Line: Predicted prices.
Vertical Lines: Key market events, including an economic announcement, earnings release, and sector news, with annotations showing potential impact points.
Visualizing Predicted vs. Actual Prices
Plot the model’s predictions against actual prices to get a visual sense of its accuracy. Line graphs showing actual vs. predicted values over time can highlight discrepancies and help identify where the model may need adjustment.
Visualization libraries such as Matplotlib and Seaborn in Python can generate graphs that make evaluation easier.
Step 6: Deploying and Monitoring the Model

Deploying the Model
Deploy the model to a production environment where it can access real-time stock data and continuously update predictions. Cloud platforms like AWS, Google Cloud, and Azure offer services for deploying machine learning models at scale.
Consider using Docker for containerization, making it easy to manage and deploy the model consistently across environments.
Monitoring Model Performance
Financial markets are dynamic. Monitor your model to ensure it remains accurate as conditions change. Regular retraining with new data can keep predictions up-to-date, while drift detection can help identify when the model’s accuracy declines over time.
table layout that summarizes model performance metrics before and after deployment, with an alert column for potential drift. Each metric is displayed alongside its pre- and post-deployment performance, with a color-coded drift alert for easy reference.
| Metric | Before Deployment | After Deployment | Alert for Potential Drift |
|---|---|---|---|
| Latency | 200 ms | 250 ms | 🟡 Moderate Drift Slight increase due to deployment environment |
| Daily Prediction Accuracy | 92% | 85% | 🔴 High Drift Accuracy decreased significantly |
| Retraining Frequency | Monthly | Bi-Weekly | 🟢 Low Drift Regular updates applied to reduce drift |
| Data Volume Processed | 1 GB/day | 1.5 GB/day | 🟢 Low Drift Increased volume handled effectively |
| Error Rate (MAE) | 3.2 | 3.5 | 🟡 Moderate Drift Minor increase in error rate observed |
Legend for Drift Alerts
- 🟢 Low Drift: Performance is consistent, and the model is adapting well to data changes.
- 🟡 Moderate Drift: Minor changes in performance metrics; monitor and consider adjustments if trends continue.
- 🔴 High Drift: Significant drift detected; immediate action recommended, such as fine-tuning or retraining.
By following these steps, you’ll create a comprehensive stock price prediction model that can adapt and improve over time. Remember, continual tuning and adaptation to market trends are key to maintaining an effective model.
FAQs
How much data do I need to predict share prices?
Typically, the more historical data you have, the better. At least 2-3 years of daily stock data is recommended for short-term predictions, while 5-10 years is useful for longer trends. Keep in mind that too much data may introduce irrelevant patterns, so finding a balance based on the prediction timeframe is key.
Which technical indicators are most useful for prediction?
Commonly used indicators include moving averages, RSI (Relative Strength Index), and MACD (Moving Average Convergence Divergence). Bollinger Bands and momentum indicators can also be useful, depending on the model and trading strategy. Each indicator has a unique way of showing price trends, volatility, or overbought/oversold conditions, making them valuable inputs.
Can I use economic data for better predictions?
Yes, incorporating economic indicators like interest rates, inflation, and GDP growth can improve long-term predictions by capturing macroeconomic influences. Sentiment analysis of news and social media data can also be beneficial for short-term models, as market sentiment often drives immediate price changes.
How do I know which model to choose?
The best model depends on your data and goals. ARIMA is suitable for linear time series data, while LSTM models work well for capturing complex dependencies in sequential data. For straightforward relationships, linear regression may be sufficient, but more complex trends often require machine learning or deep learning models.
What tools or platforms are needed to build the model?
Popular tools for building stock prediction models include Python (with libraries like pandas, NumPy, and Scikit-learn), TensorFlow/Keras for deep learning, and cloud platforms like AWS, Google Cloud, or Azure for deployment. Jupyter Notebooks or VS Code are commonly used for development and testing.
How often should I retrain the model?
Retraining frequency depends on how quickly the market conditions change. For daily or weekly models, retraining every month or quarter can keep predictions accurate. Real-time models in production environments may need continuous retraining using live data feeds to stay up-to-date.
Are prediction models guaranteed to work?
No model can guarantee accurate predictions due to the inherent uncertainty in financial markets. Even the most advanced models are based on probabilistic predictions. Effective models improve decision-making by providing likely trends but still carry a margin of error.
Can I use the same model for different stocks?
While it’s possible, individual stocks have unique behaviors, volatility patterns, and sensitivities. Customizing models for each stock often produces better accuracy, as a model fine-tuned on a specific stock’s characteristics can capture its unique price movement patterns.
How can I handle missing data in stock datasets?
Handling missing data is essential for accuracy. Common strategies include:
- Imputation: Filling missing values with the mean or median of the data.
- Forward and backward fill: Using the previous or next valid observation to fill gaps, which works well for short gaps.
- Dropping rows: If missing values are sparse, dropping rows with gaps may be effective, though this reduces the dataset size.
Choosing a method depends on how much data is missing and the importance of specific data points.
Is LSTM the best model for stock prediction?
LSTMs are popular for stock predictions because they are designed to capture sequential dependencies, making them well-suited for time-series data. However, the best model depends on data complexity, prediction timeframe, and computational resources. In some cases, simpler models like ARIMA or linear regression can work just as well, especially for short-term or linear trends.
How important is feature scaling?
Feature scaling is crucial for models that rely on distance calculations or neural networks, as unscaled data can lead to biased predictions. Normalization (scaling values between 0 and 1) or standardization (scaling values to have a mean of 0 and a standard deviation of 1) can significantly improve model performance. Without scaling, models may struggle to learn relationships between features with different ranges.
How can I evaluate the model’s accuracy?
To evaluate model performance, use metrics that measure prediction error:
- Mean Squared Error (MSE): Measures average squared differences between predicted and actual values.
- Root Mean Squared Error (RMSE): Provides error size in the original unit, making it easier to interpret.
- Mean Absolute Percentage Error (MAPE): Calculates error as a percentage, which helps compare predictions across stocks.
Using multiple metrics can give a well-rounded view of the model’s accuracy.
What are common pitfalls to avoid in stock prediction?
Common pitfalls include:
- Overfitting: When the model learns noise rather than actual patterns. Techniques like regularization, dropout, or using simpler models can help prevent this.
- Ignoring market context: Stock prices are affected by various factors, including economic indicators and global events. Incorporating relevant economic data can improve model performance.
- Data leakage: Accidentally using information from the future (like future stock prices) in the training set, which can lead to overly optimistic predictions.
Understanding these issues and monitoring for them during model building can improve prediction reliability.
Can I use real-time data with my model?
Yes, real-time data can be used, but it requires infrastructure for data streaming, processing, and immediate model retraining. Tools like Kafka for streaming, AWS Lambda for serverless processing, and cloud-based machine learning services can support real-time applications. However, real-time models also need rigorous monitoring and regular updates to account for changing market dynamics.
How long does it take to build a prediction model?
Building a basic prediction model might take a few days to a week, but fine-tuning, feature engineering, and evaluation can take several weeks depending on data complexity and model choice. Deploying and monitoring the model adds additional time, especially for real-time applications that require consistent updates and maintenance.
What programming languages are most common for stock prediction?
Python is the most commonly used language due to its robust data science libraries (pandas, Scikit-learn, TensorFlow, and Keras). R is also popular for statistical modeling and data analysis in finance. For high-frequency trading models or low-latency requirements, C++ or Java might be used for efficiency, but Python is preferred for its flexibility and ease of use.
Is stock prediction suitable for beginner data scientists?
Stock prediction can be challenging due to the complexity and unpredictability of financial data, so it may not be the ideal first project. However, it’s a rewarding project for those with a strong foundation in data science and an understanding of finance basics. Beginners may want to start with simpler predictive modeling tasks before tackling financial time-series data.
How often should I update the model’s dataset?
Regular updates are essential to keep the model relevant. For daily predictions, update the model weekly or monthly to capture recent trends. High-frequency models used in trading may require real-time updates, especially when market conditions shift rapidly. Setting up a continuous data pipeline can automate these updates efficiently.
Can I integrate sentiment analysis into my model?
Yes, integrating sentiment analysis from news articles, social media, or other sources can improve short-term predictions. Positive or negative sentiment often drives stock price movements in the short term. Natural language processing (NLP) techniques and APIs like Google Natural Language API or VADER for Python can analyze sentiment and incorporate it as a feature in your model.
What risks are associated with stock prediction models?
Risks include:
- Market volatility: Sudden economic changes or unexpected events can invalidate predictions.
- Over-reliance on model accuracy: No model is 100% accurate, so using predictions as a sole basis for decisions can lead to losses.
- Data privacy and security: For real-time trading models, ensure the data is secured, and that model access is controlled to prevent unauthorized access or manipulation.
Resources
Data Sources for Historical and Real-Time Stock Data
- Yahoo Finance
- Description: A widely used source for historical stock prices, financial data, and technical indicators.
- Access: Yahoo Finance API (often used through
yfinancePython package). - Best For: Free historical data, accessible through Python.
- Alpha Vantage
- Description: Provides real-time and historical stock data, along with technical indicators.
- Access: Alpha Vantage API. Free tier available with limited API calls.
- Best For: Access to technical indicators and real-time updates.
- Quandl
- Description: Financial, economic, and alternative data, offering premium datasets beyond basic stock data.
- Access: Quandl API.
- Best For: Accessing premium data, such as economic indicators, alongside stock price data.
- Polygon.io
- Description: Real-time and historical data on stocks, forex, and cryptocurrencies.
- Access: Polygon.io API.
- Best For: High-frequency trading models and extensive financial data.
- IEX Cloud
- Description: Provides historical, real-time, and financial data on stocks and markets.
- Access: IEX Cloud.
- Best For: Financial statements, stock prices, and sector performance data.
Essential Tools and Libraries
- Python Programming Language
- Description: The most commonly used language for data science and finance due to its versatility and robust ecosystem.
- Download: Python.org.
- Best For: Developing machine learning models, data analysis, and handling financial data.
- Jupyter Notebook
- Description: An interactive development environment that supports Python code, visualizations, and markdown.
- Download: Available with Anaconda or install via
pip. - Best For: Interactive coding, data visualization, and model experimentation.
- pandas
- Description: A Python library for data manipulation and analysis, essential for time series data processing.
- Installation:
pip install pandas - Best For: Handling and cleaning data, creating features, and preparing data for modeling.
- NumPy
- Description: A fundamental library for numerical computations in Python.
- Installation:
pip install numpy - Best For: Mathematical operations and efficient handling of large datasets.
- Scikit-learn
- Description: A popular machine learning library in Python with tools for data preprocessing, model training, and evaluation.
- Installation:
pip install scikit-learn - Best For: Applying machine learning algorithms, feature scaling, and cross-validation.
- TensorFlow and Keras
- Description: Frameworks for building and deploying deep learning models, including LSTM networks for time-series data.
- Installation:
pip install tensorflow - Best For: Creating deep learning models, especially LSTMs and RNNs for sequential data.
- Matplotlib and Seaborn
- Description: Libraries for data visualization in Python.
- Installation:
pip install matplotlib seaborn - Best For: Plotting stock prices, visualizing model predictions, and analyzing data distributions.
Courses and Tutorials
- Machine Learning for Trading by Georgia Tech (Coursera)
- Description: Covers the fundamentals of machine learning as applied to finance and trading.
- Link: Coursera
- Best For: Learning how machine learning can enhance trading strategies.
- Finance and Data Science on Udemy
- Description: Various courses focusing on stock prediction, algorithmic trading, and Python for finance.
- Link: Udemy Finance Courses
- Best For: Beginner-friendly courses and practical examples in stock prediction.
- Python for Financial Analysis and Algorithmic Trading (Udemy)
- Description: An introductory course that focuses on using Python for finance, including stock data analysis and prediction.
- Link: Python for Finance on Udemy
- Best For: Learning Python techniques for financial analysis and prediction.
- Deep Learning Specialization by Andrew Ng (Coursera)
- Description: A comprehensive series on deep learning, covering LSTM and RNNs.
- Link: Deep Learning Specialization
- Best For: Building deep learning models, including those for time series forecasting.
- Time Series Forecasting with Python (DataCamp)
- Description: A practical course covering time series analysis and prediction with Python.
- Link: DataCamp Time Series Forecasting
- Best For: Learning essential time series techniques for financial modeling.