What is CatBoost? A Quick Overview
CatBoost, a gradient boosting algorithm, has taken the machine learning world by storm, especially in handling categorical data.
Developed by Yandex, this powerful model can work with both classification and regression tasks.
CatBoost stands for “Categorical Boosting,” and it’s designed to efficiently handle categorical features, which most traditional models struggle with. It uses gradient boosting on decision trees, a method where new models are created to correct errors made by the previous ones, leading to highly accurate results over time.
What sets CatBoost apart is its ease of use and robust performance without extensive preprocessing. You can literally throw raw data at it—without heavy encoding—and it will figure things out.
Why Choose CatBoost for Time-Series?
Time-series forecasting is all about making predictions based on data points collected over time. The challenge here? Data dependency on previous time steps. That’s where CatBoost comes into play.
CatBoost excels in time-series tasks due to its ability to handle large datasets with complex patterns. It captures both short- and long-term dependencies, making it ideal for forecasting everything from stock prices to electricity demand.
Unlike traditional models, which may need extensive feature engineering, CatBoost can automatically select relevant features and deal with missing values or outliers. The result is a streamlined forecasting process that’s both faster and more accurate.
Key Features of CatBoost: Boosting Accuracy in Forecasting
- Handling categorical data directly: This is a major plus for time-series data, which often involves categories such as “day of the week” or “season.”
- Fast training and prediction times: Compared to other boosting algorithms like XGBoost or LightGBM, CatBoost is designed for speed.
- Robust to overfitting: Time-series data often suffer from overfitting, especially with smaller datasets. CatBoost’s regularization techniques help mitigate this issue.
- Built-in cross-validation: It allows you to validate models on the fly, ensuring the best hyperparameters are used.
- Monotonicity constraints: If your data has a known trend, like sales always increasing with time, you can enforce this directly in the model.
These features make CatBoost an incredible choice when dealing with time-dependent data, even in high-stakes scenarios like financial or health-related forecasting.
Preparing Time-Series Data for CatBoost
Before diving into the modeling, it’s crucial to properly prepare your time-series data for CatBoost. Although CatBoost handles a variety of data types smoothly, time-series requires a specific approach.

- Lag features: The past is key to predicting the future. Create lagged versions of your features to allow CatBoost to “look back” and learn from the data’s history.
- Date-time features: Break your time column into useful components such as the day of the week, month, or even hour. These can be particularly useful for periodic trends.
- Target encoding: For categorical features, target encoding helps in preserving the temporal order of the data while providing the model with more meaningful inputs.
- Missing values: Don’t worry too much! CatBoost can handle missing data efficiently by using the ordered boosting technique. However, preprocessing for consistency never hurts.
Following these steps ensures that your data is in the best possible shape to be fed into a CatBoost model.
How to Handle Categorical Data in Time-Series with CatBoost
Categorical data plays a huge role in time-series forecasting. Think about day of the week, holiday seasons, or even weather conditions—all of which are crucial in predicting sales, traffic, or energy consumption.

CatBoost’s handling of categorical features is one of its biggest advantages. It doesn’t require extensive encoding like one-hot or label encoding, which can blow up your feature space and increase computational costs. Instead, it uses a smart combination of target encoding and feature transformations based on the data itself.
To make the most of categorical data, follow these tips:
- Label encode date-time features: Split them into meaningful parts like year, month, and day. Use these parts as input to the model.
- Aggregate statistics: Calculate rolling means, sums, and other stats based on categories like weeks, months, or seasons.
- Use CatBoost’s built-in feature processing: This simplifies the entire process and ensures that important time-based relationships are captured.
By fully leveraging these techniques, you’ll see better, more reliable forecasts with CatBoost.
Step-by-Step Guide: Building a Time-Series Model with CatBoost
Building a time-series model with CatBoost is straightforward if you follow a structured process. Here’s how you can get started:
- Data Preparation: Begin by creating lagged features and extracting useful time-related information such as the day of the week, month, or hour from the datetime column.
- Train-Test Split: Since time-series data is inherently ordered, ensure you split the data in a chronological order. The past will be used to predict the future. Don’t shuffle your data.
- Feature Engineering: Apart from lags and date parts, you can create rolling statistics (like moving averages or sums) and include domain-specific features relevant to your forecasting problem.
- Initialize CatBoost: You’ll initialize a CatBoostRegressor (for regression tasks) or CatBoostClassifier (for classification tasks), and define your model parameters, like the number of iterations, learning rate, etc.
- Fit the Model: With CatBoost’s efficiency, fitting the model is quick. Once you have your data ready and model initialized, use the
fit()method to train it on your time-series data.
This systematic approach ensures your CatBoost model is well-equipped to handle the temporal dependencies and complexities of time-series forecasting.
Time-Series Decomposition Diagram
Time-series data often has trends, seasonality, and random noise that need to be identified before building a model. A Time-Series Decomposition Diagram breaks the data into these three components. For example, it may reveal a rising trend in sales over the years, a seasonal pattern where sales spike during the holidays, and residuals, which represent unpredictable fluctuations. This decomposition is crucial for understanding the underlying structure of the data before feeding it into CatBoost. By visualizing trends and seasonality, the model can better account for these patterns during the forecasting process, leading to more accurate predictions.

Hyperparameter Tuning for Optimal Performance
Getting the best out of CatBoost involves hyperparameter tuning. While CatBoost works well out of the box, fine-tuning key parameters can help extract maximum accuracy and efficiency, especially in time-series forecasting.
Here’s what to focus on:
- Learning Rate: A lower learning rate leads to better accuracy but increases training time. It’s essential to strike a balance here. A rate between 0.01 and 0.1 is typically optimal.
- Iterations: More iterations allow the model to learn better but can increase the risk of overfitting. A good starting point is around 500 to 1000 iterations.
- Depth: The depth of decision trees can vary depending on the complexity of your data. For time-series data, a depth between 6 and 10 often works well.
- L2 Regularization: This helps in controlling overfitting, particularly with time-series data that may suffer from temporal noise.
To find the best set of hyperparameters, you can use grid search or random search methods, or even CatBoost’s built-in cross-validation feature, which simplifies the process.
Feature Importance in CatBoost: Why It Matters for Time-Series
Understanding which features contribute the most to your time-series predictions is crucial for improving model performance and gaining insights.
CatBoost provides an easy way to check feature importance, helping you focus on the variables that matter. For time-series data, features like lagged variables, seasonality indicators, and rolling averages are often the most influential.
Why should you care about feature importance?
- Better interpretability: Knowing which features impact your model’s decisions helps build trust in the predictions.
- Improved performance: You can reduce model complexity by removing features that don’t add value, leading to faster training times and less risk of overfitting.
Use the get_feature_importance() method in CatBoost to visualize and understand the importance of each feature in your time-series model.

Handling Seasonality and Trends in Time-Series Data
Seasonality and trends are key components of most time-series data. Whether it’s daily, weekly, or yearly patterns, recognizing these elements is vital for accurate forecasting.
CatBoost can model these patterns, but it’s up to you to help the model by creating features that represent seasonality. Here’s how:
- Seasonal features: Add indicators for specific timeframes (e.g., whether it’s a weekend, holiday, or peak season).
- Trend features: Identify upward or downward trends in your data and create trend-related features, like cumulative sales over time or year-over-year changes.
By acknowledging and explicitly modeling seasonality and trends, CatBoost can capture these time-based relationships more effectively.
Avoiding Overfitting in CatBoost Models
Overfitting is a common issue, especially in time-series forecasting, where the model can perform brilliantly on training data but fails on new, unseen data. CatBoost includes several techniques to combat overfitting, but it’s important to be mindful when setting up your model.
Here are some strategies:
- Use cross-validation: This is critical in time-series forecasting to ensure that the model generalizes well. Use a time-based sliding window or K-fold cross-validation to validate performance.
- Tune regularization parameters: Both L2 regularization and depth constraints help in controlling model complexity, which prevents the model from capturing noise in the data.
- Limit the number of iterations: Too many iterations can lead to the model memorizing the training data. Monitor the validation loss to identify the optimal number of iterations.
By incorporating these strategies, you can build a CatBoost model that generalizes well to future data, ensuring reliable forecasts.
Evaluating Forecast Accuracy: Key Metrics to Watch
Once you’ve trained your CatBoost time-series model, it’s essential to evaluate how well it’s performing. For time-series forecasting, some common metrics can help measure accuracy and identify areas for improvement.

Here are the key metrics to track:
- Mean Absolute Error (MAE): This measures the average magnitude of the errors in predictions, without considering their direction. MAE is easy to interpret and gives a sense of the average deviation.
- Mean Squared Error (MSE): This penalizes larger errors more than MAE because the errors are squared before averaging. It’s a useful metric if you care more about large errors.
- Root Mean Squared Error (RMSE): By taking the square root of MSE, this metric gives you an error rate closer to the scale of the actual data, making it more interpretable.
- Mean Absolute Percentage Error (MAPE): This metric expresses forecast error as a percentage, which makes it easier to understand the relative size of the errors in relation to actual values.
Evaluating performance on these metrics will give you insights into how well your CatBoost model is forecasting, helping you fine-tune and improve it further. You should regularly monitor these metrics as you experiment with different feature sets or hyperparameters.
Practical Applications of CatBoost in Real-World Time-Series Data
CatBoost is highly versatile, which makes it suitable for a wide variety of real-world time-series forecasting applications. From predicting customer demand to financial market trends, CatBoost has proven effective in several domains.
- Retail Sales Forecasting: Retail companies use time-series forecasting to predict product demand. By leveraging seasonal trends, holidays, and promotional data, CatBoost helps retailers optimize inventory and reduce waste.
- Energy Consumption Prediction: In the energy sector, accurate forecasting of power demand is crucial. CatBoost’s ability to handle historical consumption data, weather variables, and holiday effects makes it ideal for predicting electricity usage.
- Financial Market Predictions: Financial institutions use CatBoost to predict stock prices and market trends by analyzing historical price movements, trading volumes, and macroeconomic indicators.
- Healthcare Forecasting: Hospitals and healthcare providers use CatBoost to predict patient admissions or the spread of diseases, based on historical data and seasonal trends.
By utilizing CatBoost in these applications, companies can make data-driven decisions and optimize their operations effectively.
Comparing CatBoost with Other Time-Series Forecasting Models
When it comes to time-series forecasting, CatBoost isn’t the only model in the game. Several other machine learning algorithms, like XGBoost, LightGBM, and traditional models like ARIMA, also provide solutions. But how does CatBoost stack up?
- CatBoost vs. XGBoost: While both models are gradient boosting algorithms, CatBoost handles categorical data more effectively and requires less preprocessing, making it better suited for complex datasets with many categorical features. XGBoost, however, may be faster for smaller datasets.
- CatBoost vs. LightGBM: LightGBM is known for its speed and performance on large datasets. However, CatBoost often yields better accuracy on datasets with categorical features, thanks to its ordered boosting and built-in categorical encoding.
- CatBoost vs. ARIMA: ARIMA models are specifically designed for time-series data and excel in capturing linear trends and seasonality. However, they may struggle with complex, non-linear patterns. CatBoost, being a tree-based model, handles non-linearity better and can incorporate a wide variety of features.
Overall, CatBoost offers significant advantages when working with time-series data that contains categorical features or requires advanced feature engineering.
Advanced Techniques: Using CatBoost with External Regressors
To further improve forecast accuracy, consider incorporating external regressors into your CatBoost model. External regressors are additional features that can enhance the model’s predictive ability by including more context from outside the time-series data itself.
For instance, when forecasting retail sales, you might include:
- Weather data: Temperature or rainfall can have a significant impact on consumer behavior.
- Economic indicators: Factors like inflation or unemployment rates might influence sales or demand in financial forecasts.
- Social media sentiment: In sectors like e-commerce, public sentiment about products can provide valuable insights into future demand.
CatBoost’s ability to handle categorical and numerical features makes it ideal for using external regressors. By combining these external factors with traditional time-series data, you can achieve more holistic and accurate forecasts.
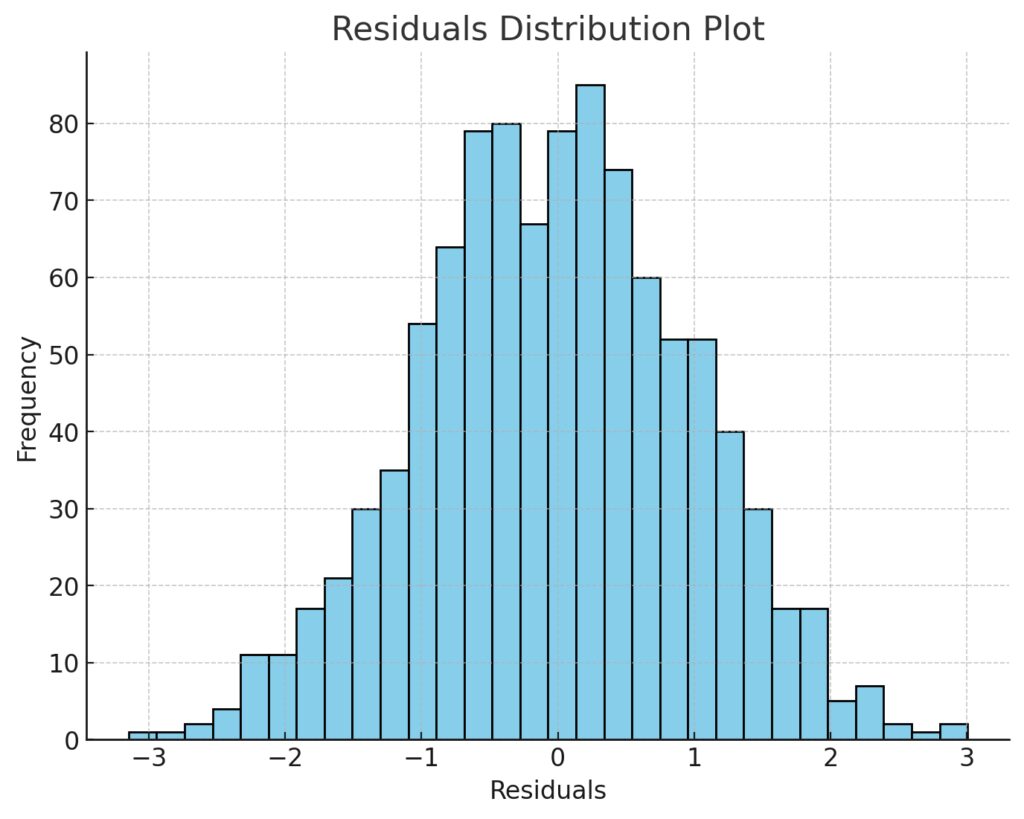
Residuals Distribution Plot
A Residuals Distribution Plot is essential for diagnosing errors in your CatBoost forecasts. Residuals, the difference between predicted and actual values, should ideally be centered around zero and randomly distributed. In a histogram or scatter plot, this would appear as a symmetric distribution with no clear patterns. If you observe a skewed or non-random distribution, it could indicate that the model is systematically over- or under-predicting certain time periods. By identifying such patterns in the residuals, you can make targeted adjustments to the model, such as refining the feature set or handling outliers more effectively.

Troubleshooting Common Challenges in CatBoost Forecasting
Even with CatBoost’s powerful algorithms, time-series forecasting can present a few common challenges. Here’s how to address them:
- Data Leakage: In time-series, data leakage can occur if future information is accidentally used in training. Ensure your lag features and train-test split respect the temporal order.
- Overfitting: Time-series data is prone to overfitting due to noise or seasonal fluctuations. To avoid this, adjust regularization parameters and consider using early stopping to prevent the model from memorizing the training data.
- Handling Missing Data: Missing values are common in time-series data. While CatBoost can handle missing values, preprocessing to fill in gaps or create flags for missing entries can lead to better predictions.
- Insufficient Feature Engineering: Without enough useful features, the model may struggle to capture the underlying patterns. Experiment with more lag features, seasonality indicators, and rolling statistics to capture the data’s temporal structure more effectively.
By staying vigilant about these challenges, you can ensure that your CatBoost time-series model performs at its best, delivering accurate and reliable forecasts.
CatBoost Official Documentation: The official documentation provides in-depth explanations and tutorials on using CatBoost for various tasks, including time-series forecasting.