
Understanding the Basics of QDA
What Is Quadratic Discriminant Analysis (QDA)?
Quadratic Discriminant Analysis (QDA) is a statistical classification technique used to separate data into distinct groups. It assumes that each class follows a Gaussian distribution, with unique covariance matrices for every class.
Unlike simpler methods like Linear Discriminant Analysis (LDA), QDA offers the flexibility to model complex, non-linear boundaries.
This makes QDA a go-to choice for diverse datasets with distinct patterns in variance.
Why Overfitting Happens in QDA
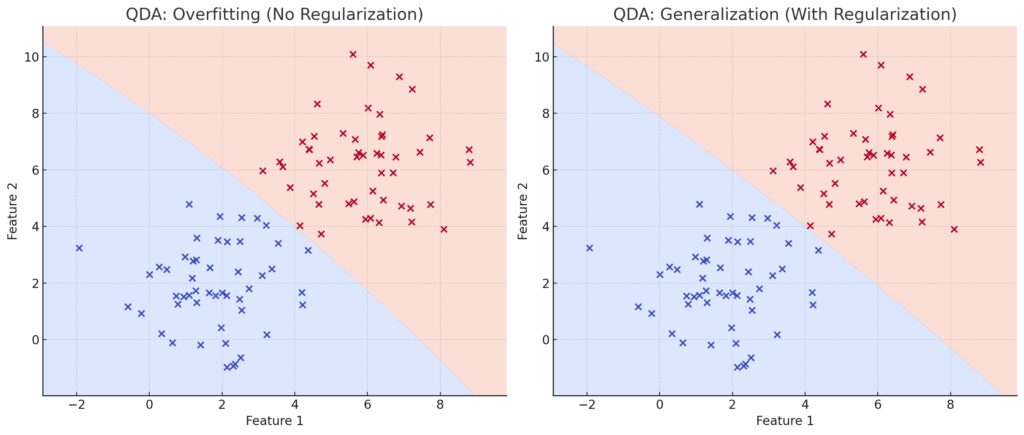
No Regularization: The QDA model overfits the training data, creating complex and wavy decision boundaries.
This may lead to poor performance on unseen data due to high sensitivity to noise.
Right Panel (Generalization):
With Regularization: The QDA model simplifies the decision boundaries, achieving better generalization by smoothing the curves.
This ensures robustness and avoids overfitting.
QDA’s strength—its ability to create intricate decision boundaries—can also be its Achilles’ heel. Overfitting occurs when the model memorizes noise in training data instead of capturing meaningful patterns.
- Small datasets with high variance often worsen this issue.
- Complex covariance structures can inflate model complexity, making it less generalizable.
Spotting Overfitting in Your QDA Model
Key signs of overfitting in QDA include:
- A drastic performance gap between training and test datasets.
- Erratic predictions when applied to new data.
- High sensitivity to small changes in input features.
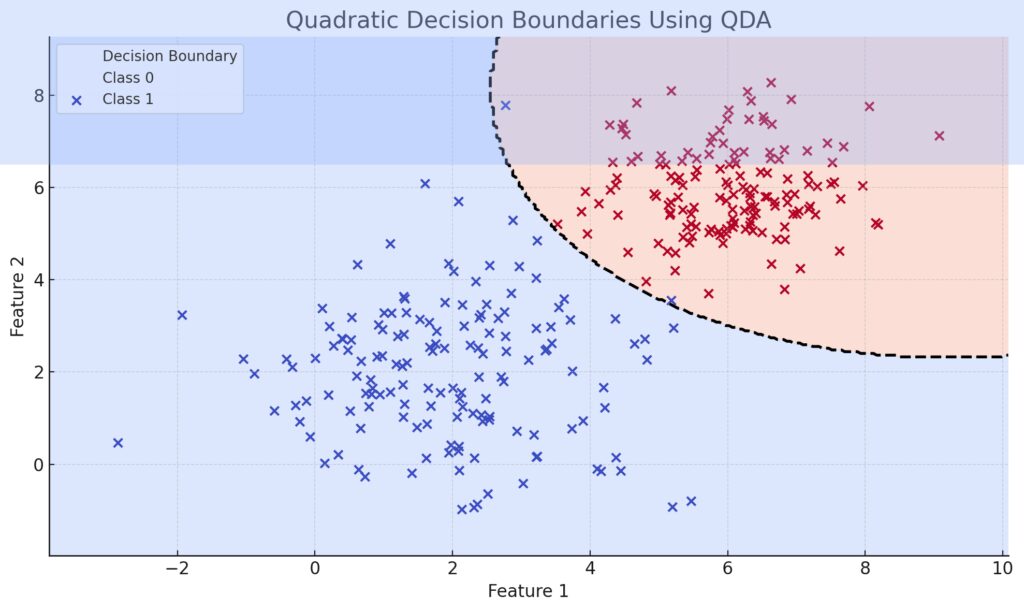
Data points are color-coded for Class 0 and Class 1.
Decision Boundary:The Quadratic Discriminant Analysis (QDA) decision boundary is shown as a dashed curve.
Demonstrates how QDA forms a non-linear decision boundary to separate the two distributions effectively.
This plot highlights the ability of QDA to model non-linear relationships between features.
The Power of Regularization in QDA
How Regularization Curbs Overfitting
Regularization introduces penalties to the model, simplifying covariance matrices to reduce noise amplification. Common strategies include:
- Shrinking covariance estimates to stabilize predictions.
- Applying ridge or lasso penalties on parameters.
Techniques to Implement Regularization
- Shrinkage Estimators: These adjust the covariance matrix toward a simpler, diagonal form, balancing flexibility and generalization.
- Parameter Constraints: Limiting the degrees of freedom for covariance estimates controls excessive variability.
Pro Tip: Scikit-learn provides an easy-to-use
shrinkageparameter for implementing this in Python. Learn more about shrinkage.
Choosing the Right Features for QDA
Why Feature Selection Matters
Overfitting can stem from irrelevant or redundant features. QDA becomes more susceptible when working with high-dimensional data, where noise drowns out signal.
Practical Steps for Feature Selection
- Principal Component Analysis (PCA): Use this to reduce dimensionality while retaining key information.
- Filter Methods: Rank features by relevance using metrics like mutual information or variance thresholds.
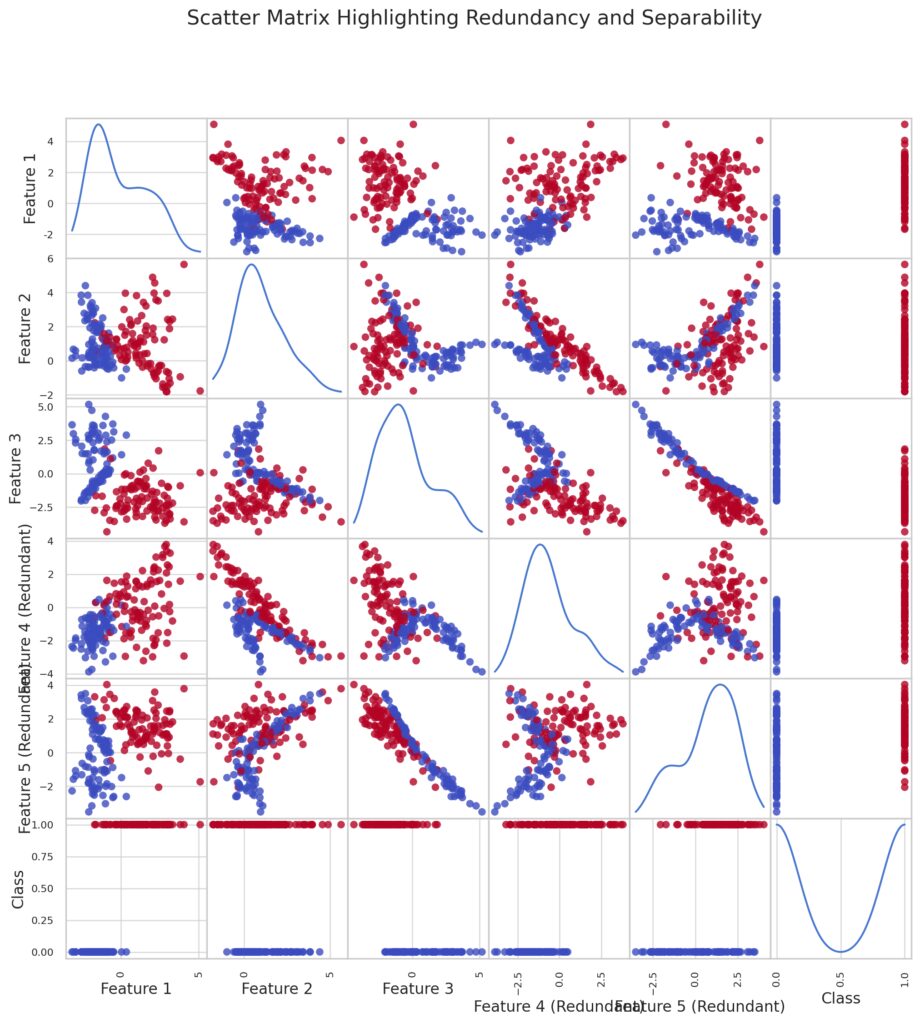
Highlights redundancy between Feature 4 and Feature 5, evident through their strong linear correlation.
Color Coding:Points are color-coded by class labels to showcase separability between classes.
Overview of feature relationships and redundancy.
Related Read: Check out this guide on PCA.
Leveraging Cross-Validation for Robust Models

Fold Processing:For each fold:Train the QDA model on k−1 folds.
Validate on the remaining fold.
Calculate performance metrics (e.g., accuracy, recall, F1 score).
Aggregation:Aggregate metrics across all folds to obtain overall performance.
The Role of Cross-Validation
Cross-validation (CV) splits your data into training and validation subsets, ensuring the model is evaluated on unseen data.
- K-fold CV is especially useful, averaging results over multiple splits for reliability.
- Leave-one-out CV offers rigorous testing for smaller datasets.
Avoiding Data Leakage
Prevent data leakage by maintaining strict separation between folds. Normalize or preprocess data within each split independently.
Optimizing QDA with Hyperparameter Tuning
Key Parameters to Tune
Tuning your QDA model’s hyperparameters can make a world of difference in curbing overfitting:
- Regularization Strength: Adjust the shrinkage factor to balance flexibility and stability.
- Covariance Estimation: Experiment with diagonal or spherical covariance assumptions for simplicity.
Automating Hyperparameter Search
Grid search and randomized search are powerful techniques for systematically finding optimal parameters.
- Use grid search when you have smaller datasets and fewer parameters.
- For larger models, try randomized search, which samples a subset of the parameter space.
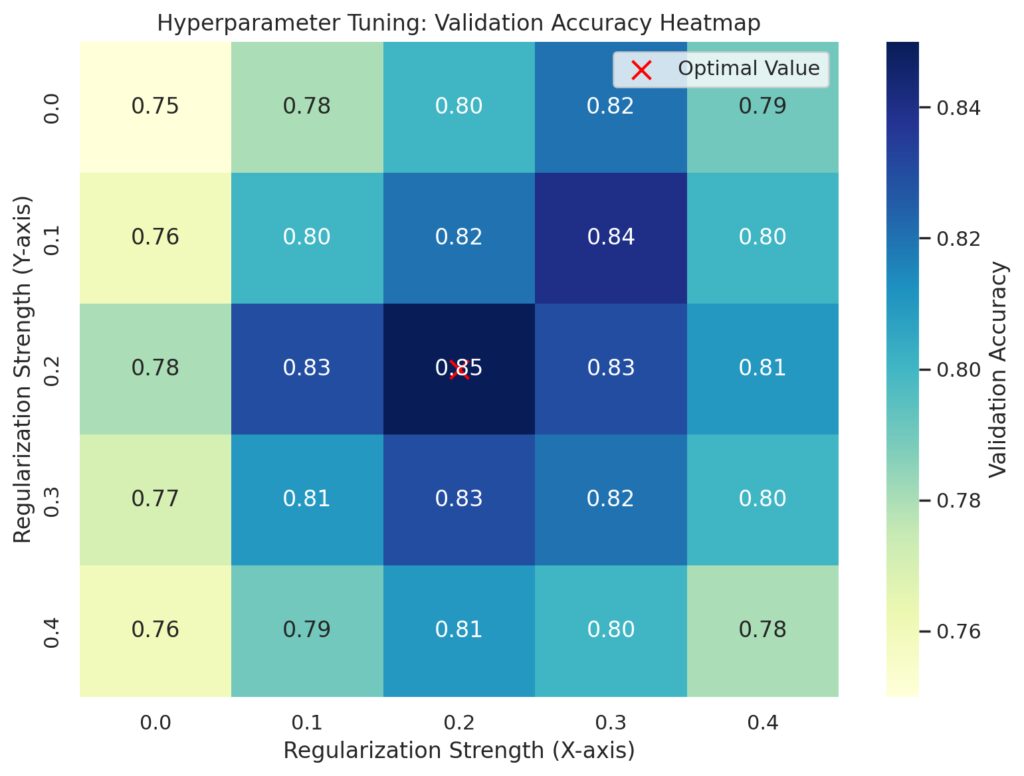
Python Tip: Use Scikit-learn’s
GridSearchCVorRandomizedSearchCVmodules for efficient hyperparameter tuning.
Data Preprocessing for QDA Success
Scaling for Stability
QDA assumes numerical stability in feature values. Ensure your data is properly scaled and normalized to avoid numerical errors.
- Min-Max Scaling: Scale features to a range between 0 and 1.
- Standardization: Transform data to have a mean of 0 and a standard deviation of 1.
Handling Outliers
Outliers can severely distort covariance estimates. Address these anomalies through:
- Clipping Extreme Values: Limit features to a defined range.
- Robust Scaling: Center data using medians instead of means.
Balancing Imbalanced Data
For datasets with unequal class distributions, employ techniques like:
- Oversampling: Duplicate minority class examples using SMOTE or similar methods.
- Weight Adjustments: Apply class weights during training to emphasize underrepresented categories.
Explore Python’s imbalanced-learn library for advanced resampling methods.
Real-World Applications of QDA
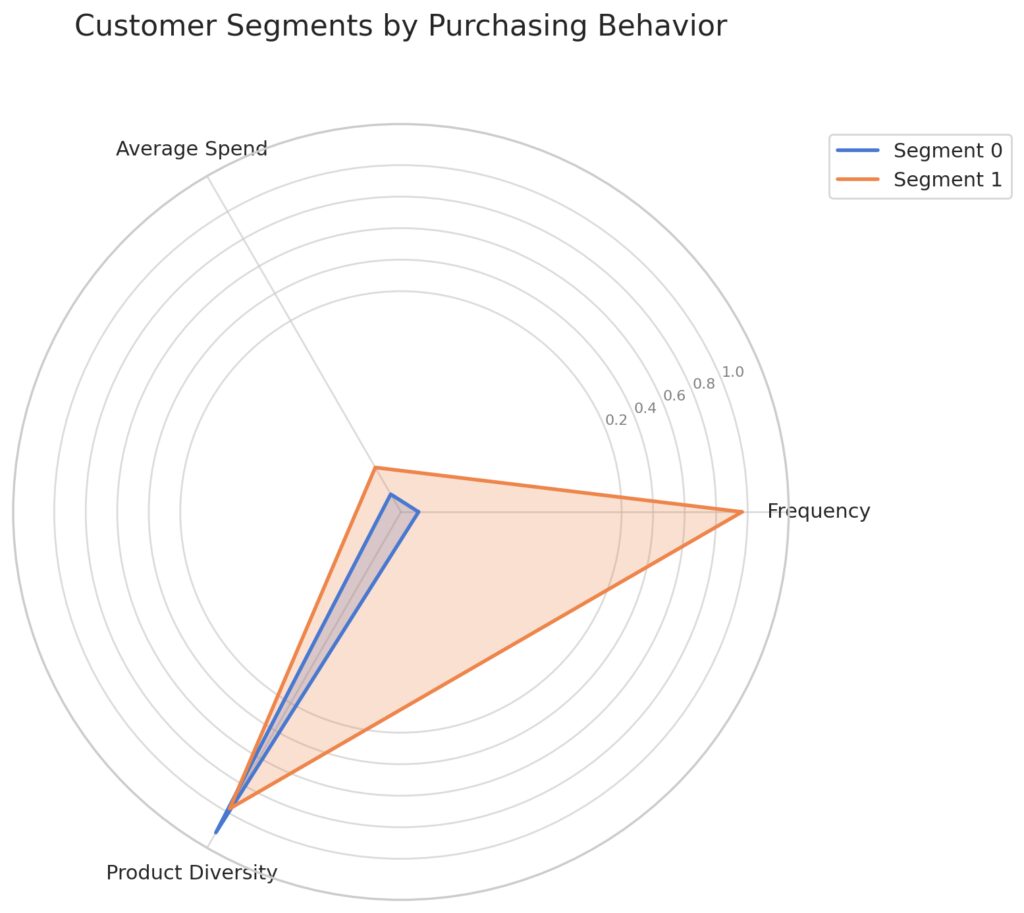
Axes: Represent key purchasing behavior features:
Product Diversity: The variety of products purchased.
Frequency: How often a customer makes purchases.
Average Spend: The average amount spent per transaction.
When to Choose QDA
QDA shines in tasks with complex decision boundaries and sufficient data. It’s widely used in:
- Financial Forecasting: Classify market trends based on high-dimensional feature sets.
- Genomics: Identify genetic markers for diseases from intricate datasets.
- Marketing Segmentation: Group customers by purchasing patterns and demographics.
QDA Success Stories
From predicting disease outbreaks to refining user recommendation systems, QDA consistently proves its value when carefully optimized.
Advanced Techniques to Elevate QDA Performance
Combining QDA with Ensemble Methods
QDA, when combined with ensemble learning, can achieve impressive generalization while minimizing overfitting.
Boosting Performance with Bagging
Bagging (Bootstrap Aggregating) trains multiple QDA models on bootstrapped subsets of the data. The final prediction is the average (regression) or majority vote (classification).
- Improves stability and reduces variance.
- Best suited for high-variance datasets with smaller sample sizes.
Hybridizing with Boosting
Boosting, such as AdaBoost or Gradient Boosting, builds models iteratively, correcting errors from prior iterations. While QDA isn’t a typical base learner, it can be wrapped with boosting frameworks to handle imbalanced data effectively.
Explore Python’s ensemble methods for integrating QDA.
Pairing QDA with Dimensionality Reduction
For high-dimensional datasets, reduce feature space complexity to complement QDA’s strengths.
Common Dimensionality Reduction Techniques
- t-SNE and UMAP: Visualize and simplify non-linear relationships.
- LDA as a Preprocessor: Use Linear Discriminant Analysis to preselect features for QDA.
Autoencoders for Feature Extraction
Neural network-based autoencoders can generate compressed feature representations. These representations often reduce noise, benefiting QDA’s performance.
Evaluating QDA Models with Advanced Metrics
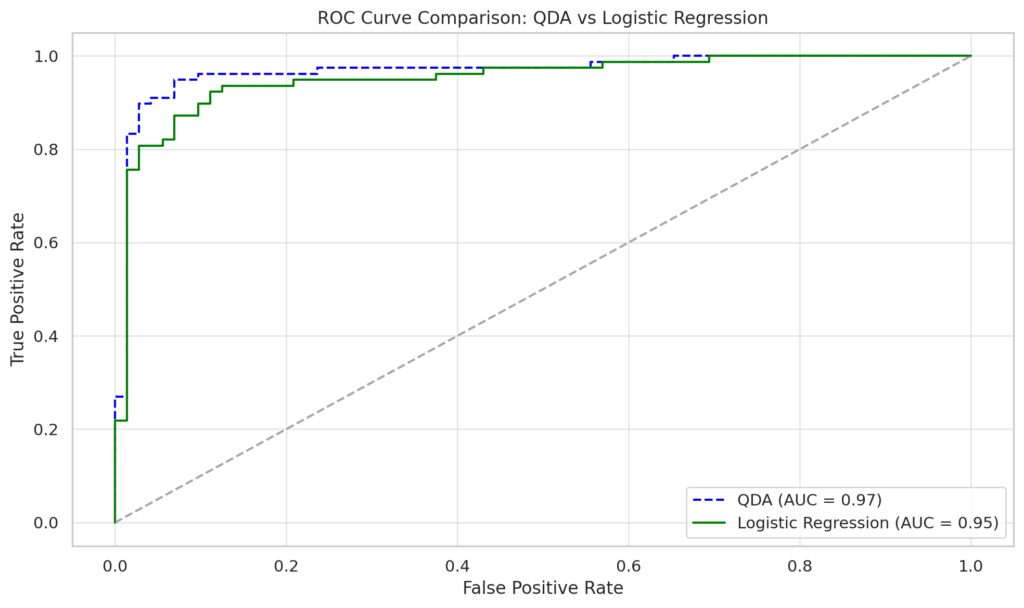
Represented by a blue dashed line.
Area Under the Curve (AUC): Reflects the model’s ability to distinguish between classes.
Logistic Regression:
Represented by a green solid line.
AUC value demonstrates its classification performance relative to QDA.
Diagonal Line: Represents a random classifier (AUC = 0.5).
Beyond Accuracy: Critical Metrics
Overfitting often skews simple accuracy metrics. Rely on a broader range of evaluation criteria:
- F1 Score: Balances precision and recall for imbalanced datasets.
- ROC-AUC: Measures the trade-off between true positives and false positives.
- Log Loss: Evaluates probabilistic predictions, penalizing confident but incorrect classifications.
Calibrating Probabilities
QDA outputs probabilities by design. Use calibration techniques, such as Platt Scaling, to ensure reliable probability estimates.
For robust evaluation, dive into Scikit-learn’s metrics module.
Strategies for QDA in Noisy Environments
Noise Reduction Techniques
Noise in data can exacerbate QDA’s tendency to overfit. Counter this with:
- Smoothing Algorithms: Kernel smoothing or moving averages for time-series data.
- Feature Engineering: Use domain knowledge to refine feature definitions.
Robustness Through Data Augmentation
Expand datasets artificially to reduce overfitting. Techniques include:
- Synthetic Data Creation: Generate new examples through bootstrapping or SMOTE.
- Transformation-Based Augmentation: Apply rotations, scaling, or noise injections to existing data.
Automation and Tools for QDA Optimization
Leveraging Python Libraries
Scikit-learn remains a reliable go-to for implementing and tuning QDA. For added capabilities, explore:
- PyCaret: Automates preprocessing, modeling, and evaluation.
- MLflow: Tracks experiments, hyperparameters, and results.
Integrating QDA in Production
Deploying QDA models at scale often requires:
- Model Serialization: Save models with
jobliborpickle. - Real-Time Inference Pipelines: Use frameworks like Flask or FastAPI for seamless integration.
With these advanced methods, your QDA model will evolve from a potential overfitting risk to a high-performing, production-ready classifier.
FAQs
What makes QDA better than LDA for certain tasks?
QDA outperforms Linear Discriminant Analysis (LDA) when the data exhibits non-linear class boundaries. For example, in fraud detection, fraudulent transactions may follow a complex, non-linear pattern that LDA cannot handle effectively.
However, QDA requires more data to estimate separate covariance matrices for each class, making it less suited for small datasets.
Can QDA handle imbalanced datasets?
Yes, QDA can manage imbalanced datasets effectively with the right strategies. Assign class weights to emphasize the minority class, or use techniques like oversampling (e.g., SMOTE) to balance the dataset.
For instance, in medical diagnosis, oversampling rare disease cases helps the model learn critical patterns without biasing toward the majority healthy cases.
How do I know if my QDA model is overfitting?
Look for these signs of overfitting:
- The model achieves high accuracy on the training set but performs poorly on the test set.
- Predictions become unstable when applied to new or unseen data.
An example is a marketing segmentation model that predicts customer groups perfectly during training but fails to generalize to new customer data.
When should I regularize my QDA model?
Regularization is beneficial when:
- Your dataset is small or noisy.
- The covariance matrices are highly variable, causing instability.
For instance, in genomic research, adding shrinkage to covariance matrices helps stabilize QDA performance when analyzing limited gene expression samples.
What preprocessing steps are essential for QDA?
Key preprocessing steps include:
- Feature Scaling: Normalize or standardize features to maintain numerical stability.
- Outlier Removal: Eliminate extreme values to prevent distortion of covariance estimates.
For example, in financial analysis, normalizing transaction amounts ensures fair contributions from features with vastly different scales.
Can QDA be used with high-dimensional data?
Yes, but it requires techniques like dimensionality reduction to handle high-dimensional data effectively. Applying PCA or autoencoders reduces feature space complexity while retaining important patterns.
In bioinformatics, dimensionality reduction simplifies thousands of gene expression features for QDA classification.
How does QDA compare to logistic regression?
While logistic regression is linear, QDA can model non-linear relationships between features. QDA is ideal for problems where class variances differ significantly, such as classifying images with variable lighting conditions.
For example, in autonomous driving, QDA might outperform logistic regression in scenarios with uneven road conditions and object variability.
Is QDA suitable for time-sensitive applications?
QDA can be efficient for inference but may require preprocessing and tuning for time-critical tasks. In real-time systems like fraud detection, regularization and careful feature selection ensure speed without sacrificing accuracy.
Can QDA be combined with deep learning?
Yes, QDA can complement deep learning by serving as a post-classifier for features extracted by neural networks. For instance, after a convolutional neural network (CNN) extracts features from images, QDA can classify objects based on these extracted features.
How does QDA handle noisy datasets?
QDA is sensitive to noise, as it relies heavily on covariance estimates. To address this:
- Use feature engineering to remove irrelevant variables.
- Apply data smoothing techniques like kernel density estimation to clean noisy features.
For example, in weather forecasting, removing outliers from temperature and wind speed data ensures that QDA models more accurate weather patterns.
What datasets are unsuitable for QDA?
QDA struggles with:
- Small datasets: It requires enough data to estimate separate covariance matrices for each class.
- Linearly separable data: Simpler models like LDA or logistic regression often suffice.
For example, a binary classification task with limited, linearly separable data (e.g., classifying sunny vs. rainy days) may not need QDA’s complexity.
What is the role of cross-validation in preventing overfitting with QDA?
Cross-validation ensures QDA is evaluated on unseen data, preventing it from overfitting the training set. K-fold cross-validation is particularly effective, as it provides an average performance metric across multiple data splits.
For instance, in marketing campaign analysis, cross-validation tests the model’s ability to generalize to new customer segments.
Can QDA work with categorical variables?
Not directly. QDA is designed for numerical data and assumes continuous features. However, categorical variables can be encoded:
- Use one-hot encoding for nominal categories.
- Apply label encoding for ordinal variables.
For example, in a housing price prediction model, QDA can use encoded variables like “house type” or “neighborhood” alongside numerical features.
How does QDA compare to support vector machines (SVMs)?
QDA and SVMs both handle non-linear boundaries, but they differ:
- QDA assumes Gaussian distributions and class-specific covariance matrices.
- SVMs do not rely on distribution assumptions and use kernel functions to model non-linearity.
For example, in spam email classification:
- QDA might excel when emails have distinct feature variances (e.g., word frequencies).
- SVM might outperform QDA when feature relationships are non-Gaussian.
Is QDA prone to multicollinearity issues?
Yes, multicollinearity (strong correlations among features) can destabilize covariance matrix estimates. Address this by:
- Using dimensionality reduction techniques like PCA.
- Removing redundant features.
For instance, in stock market prediction, removing correlated indicators (e.g., similar stock indices) improves QDA’s robustness.
How does feature selection impact QDA?
Feature selection reduces the risk of overfitting by eliminating irrelevant or noisy variables. Methods like mutual information ranking or filter methods identify the most informative features.
In customer segmentation, focusing on key metrics like purchase frequency and average spend simplifies QDA without sacrificing accuracy.
How does QDA handle imbalanced class distributions?
QDA accounts for class probabilities by default but may still favor the majority class. Mitigate this by:
- Assigning class weights inversely proportional to class frequencies.
- Using oversampling or undersampling to balance data.
For example, in rare disease prediction, oversampling minority disease cases helps QDA learn critical patterns effectively.
Can QDA be used in ensemble methods?
Yes! QDA fits well into ensemble frameworks:
- Use it as a base learner in bagging or boosting algorithms.
- Combine it with other classifiers in stacking ensembles for diverse predictions.
In financial fraud detection, combining QDA with decision trees in an ensemble improves robustness against noisy transaction data.
What are the common pitfalls when using QDA?
- Overfitting: Happens when the dataset is small or noisy.
- Computational Costs: Estimating covariance matrices for large datasets can be resource-intensive.
- Assumption of Gaussian Distributions: Violations of this assumption reduce QDA’s effectiveness.
For instance, in image recognition tasks, preprocessing to approximate Gaussian distributions improves QDA’s classification performance.
Resources
Books and Academic Resources
- “The Elements of Statistical Learning” by Hastie, Tibshirani, and Friedman
- Comprehensive guide on statistical learning, including QDA, LDA, and regularization techniques.
- Available here.
- “Pattern Recognition and Machine Learning” by Christopher M. Bishop
- Covers QDA in the context of probabilistic models and decision boundaries.
- “Applied Multivariate Statistical Analysis” by Johnson and Wichern
- A detailed exploration of multivariate techniques like QDA with real-world applications.
Online Tutorials and Articles
- Scikit-learn Documentation
- Provides a practical introduction to implementing QDA with examples.
- Visit Scikit-learn’s QDA page.
- Towards Data Science (TDS) Articles
- Articles like “Understanding Discriminant Analysis” dive into QDA and its real-world applications.
- GeeksforGeeks
- Beginner-friendly guides with Python code for QDA and related methods.
- Explore here.
Videos and Courses
- Andrew Ng’s Machine Learning Course (Coursera)
- Explains classification, LDA, and extensions like QDA in an approachable manner.
- Check it out.
- YouTube Tutorials on QDA
- Channels like StatQuest and Data School offer accessible explanations of QDA and overfitting.
- Kaggle Courses
- Hands-on tutorials for feature engineering and overfitting solutions.
- Explore Kaggle Courses.
Research Papers and Case Studies
- “Regularized Discriminant Analysis” by Friedman (1989)
- A foundational paper discussing QDA regularization techniques.
- Access via JSTOR.
- Case Studies in Bioinformatics and Financial Data
- Explore applications of QDA in journals like Bioinformatics and Journal of Finance.
Coding Platforms and Notebooks
- Kaggle and GitHub
- Search for public datasets and QDA projects to practice.
- Example: “QDA with Feature Selection on Kaggle”.
- Google Colab Notebooks
- Use free computational resources to implement QDA models.
- Start here.
Tools and Libraries
- Scikit-learn
- Easy-to-use implementation of QDA with preprocessing and regularization options.
- Install via:
pip install scikit-learn.
- PyCaret
- Automates QDA model training and evaluation.
- Explore PyCaret.
- Statsmodels
- Useful for statistical analysis alongside QDA implementations.