
Understanding the trade-offs between accuracy and interpretability is crucial in the field of explainable AI (XAI). Principal Component Analysis (PCA) offers a fascinating approach to balance these priorities.
By simplifying high-dimensional data while retaining its essence, PCA enhances model performance and interpretability. But how does it work in XAI, and what challenges come with its use? Let’s dive deeper.
What is PCA? Simplifying Complexity in AI
PCA Demystified: A Beginner-Friendly Overview
PCA, or Principal Component Analysis, is a statistical technique that reduces data dimensions. It transforms a large set of variables into a smaller one while retaining as much information as possible.
Think of it as distilling the essence of complex data into a more digestible format. For example, in a dataset with hundreds of features, PCA identifies the most significant patterns, simplifying the analysis.
By reducing dimensionality, PCA prevents overfitting in machine learning models, speeding up computations and making data visualization more practical.
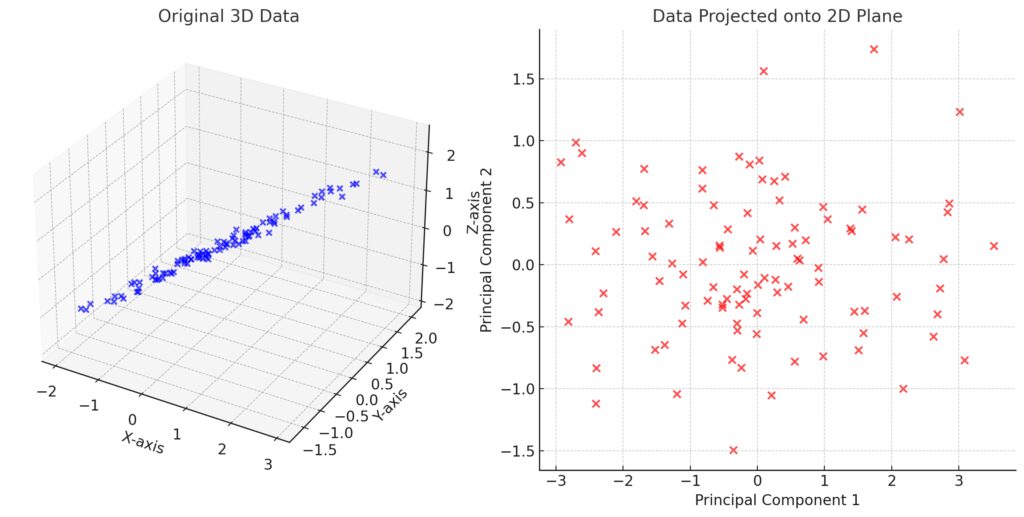
2D Projection: The scatter plot shows the data after PCA has reduced it to two dimensions, with the axes labeled as Principal Component 1 (PC1) and Principal Component 2 (PC2).
Why PCA is Relevant to Explainable AI
Explainability requires a clear understanding of how models make decisions. In high-dimensional datasets, it’s tough to pinpoint which features drive predictions.
PCA reveals patterns in data, aiding experts in interpreting results. By highlighting the most impactful variables, it bridges the gap between model complexity and user understanding.
The Role of PCA in Explainable AI
Enhancing Interpretability Without Sacrificing Performance
PCA is a cornerstone for building transparent models. It simplifies data structures, making it easier to visualize relationships. For instance:
- In healthcare, PCA can prioritize patient symptoms critical for diagnosis.
- In finance, it clarifies which metrics influence credit scoring.
The reduced complexity enables domain experts to extract insights without being overwhelmed by the data’s volume.
Tackling the Curse of Dimensionality
High-dimensional datasets often suffer from the “curse of dimensionality,” where irrelevant features dilute model accuracy. PCA addresses this by eliminating redundancy and noise.
For example, in an image recognition task, PCA can reduce millions of pixels into a handful of key patterns, maintaining the model’s accuracy while streamlining explanations.
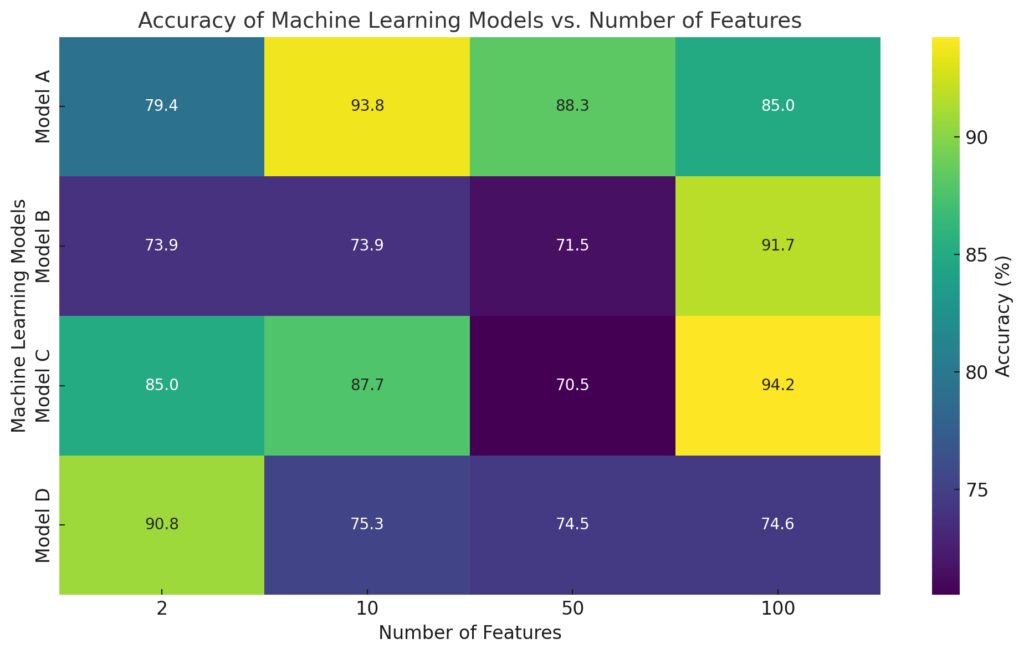
Comparing the accuracy of different machine learning models trained on datasets with varying numbers of features:
Color Gradient: Indicates model performance, with darker shades representing higher accuracy percentages.
X-Axis: Represents the number of features in the dataset (e.g., 2, 10, 50, 100).
Y-Axis: Lists the different machine learning models.
Challenges of Using PCA in Explainable AI
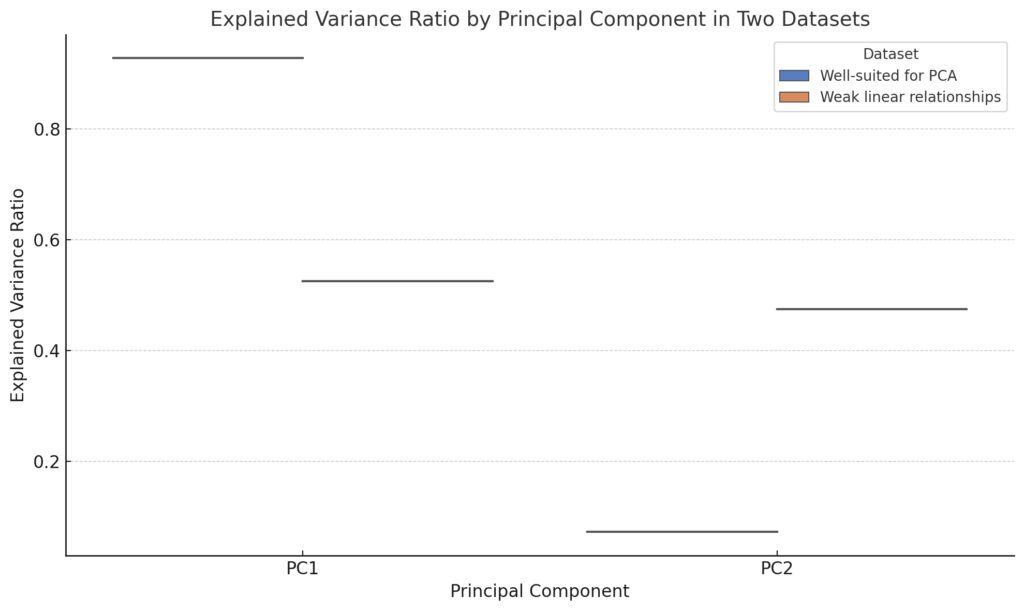
Well-suited for PCA: This dataset exhibits strong linear relationships, resulting in a higher explained variance ratio for PC1 and significant variance retained in PC2.
Weak linear relationships: This dataset has weak linear correlations, leading to more evenly distributed and lower explained variance across both principal components.
The Trade-off Between Accuracy and Insight
Although PCA simplifies data, it transforms features into principal components, which are linear combinations of original variables.
This abstraction makes direct interpretations harder. For example:
- What does “Principal Component 1” mean in terms of real-world features?
- How do these components relate to actionable decisions?
Balancing accuracy and interpretability requires careful tuning of PCA parameters and complementary techniques.
Risk of Information Loss
PCA isn’t perfect. Reducing dimensions inevitably discards some information. While it prioritizes high-variance features, lower-variance ones might hold critical insights.
For example, outliers—often indicative of rare but significant events—might get lost in PCA, potentially skewing model interpretations.
Integrating PCA with Other Explainability Techniques
Combining PCA with Shapley Values
Shapley values quantify the contribution of each feature to a prediction. Pairing them with PCA helps break down principal components into original variables, improving interpretability.
Leveraging PCA for Data Visualization in XAI
Visualization tools like t-SNE and UMAP often work well with PCA for exploring clusters or decision boundaries in datasets. This synergy amplifies both insights and clarity.
Let’s move on to explore practical applications and real-world examples of PCA in explainable AI.
Practical Applications of PCA in Explainable AI
Principal Component Analysis (PCA) finds wide use across industries where data-driven decisions must balance accuracy and insight. Its ability to simplify datasets without losing essential details makes it a powerful tool in explainable AI. Here’s how PCA transforms real-world scenarios.
PCA in Healthcare: Simplifying Diagnostic Models
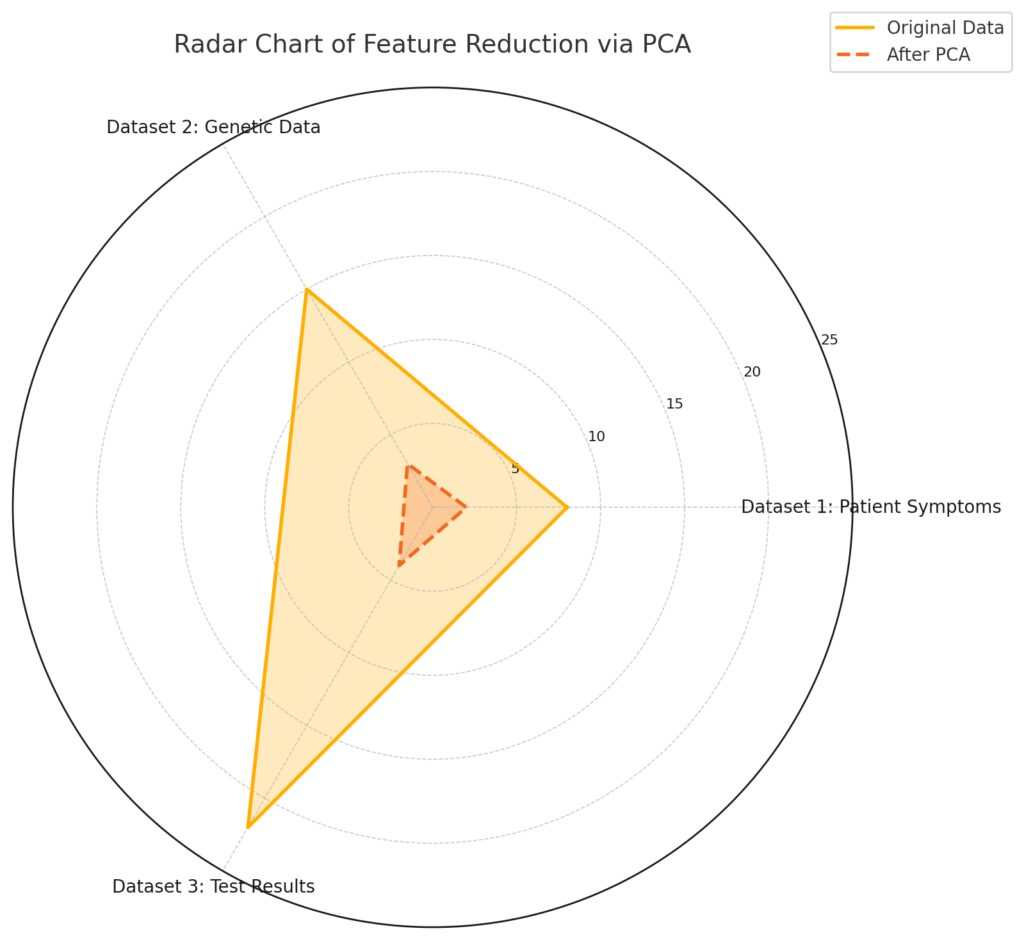
Categories: Represent the datasets: Patient Symptoms, Genetic Data, and Test Results.Original Data: Shows the number of original features for each dataset, represented by the solid line.After PCA: Highlights the reduced number of dimensions (principal components), represented by the dashed line.Color Coding: Each area is shaded to visually distinguish between the original and PCA-transformed data.
Improving Patient Outcome Predictions
Healthcare datasets are often vast, encompassing medical histories, test results, and genetic data. PCA condenses this complexity into manageable components, highlighting the features that matter most.
For example:
- Diabetes Risk Analysis: PCA can isolate critical variables like blood sugar levels, BMI, and family history, streamlining predictive models.
- Genomic Studies: Researchers use PCA to identify gene expressions linked to diseases, cutting through the noise of thousands of data points.
These insights help medical professionals explain decisions, enhancing trust in AI-assisted diagnostics.
Tackling Overfitting in High-Dimensional Medical Data
By reducing dimensionality, PCA mitigates overfitting—a common issue in predictive healthcare models with limited patient samples. Models become more robust, offering consistent, explainable results.
Finance and PCA: Demystifying Credit Scoring
Uncovering Key Drivers of Creditworthiness
Financial institutions rely on explainable AI to justify loan approvals or rejections. PCA simplifies the analysis of customer data, including income, credit history, and spending patterns.
- Principal Components reveal hidden relationships, like how a combination of income stability and debt-to-income ratio predicts repayment ability.
- Credit officers can communicate these patterns to customers, increasing transparency and compliance with regulatory requirements.
Streamlining Risk Assessment Models
In complex markets, understanding risk factors is vital. PCA reduces noise in financial datasets, helping analysts focus on actionable trends, such as the impact of macroeconomic indicators on investments.
PCA in Manufacturing: Enhancing Process Optimization
Identifying Quality-Control Variables
In manufacturing, explainable AI ensures production processes meet quality standards. PCA identifies the most impactful variables, such as temperature, pressure, or material composition, in quality control systems.
For instance:
- Automotive companies use PCA to analyze sensor data from assembly lines, pinpointing inefficiencies or anomalies.
- By focusing on key metrics, PCA supports real-time decisions while keeping explanations user-friendly.
Supporting Predictive Maintenance
PCA helps manufacturers monitor equipment health by analyzing vibration patterns, temperature readings, and usage logs. Reduced data dimensions make predictive maintenance more efficient and explainable.
Retail Insights: Personalization and PCA
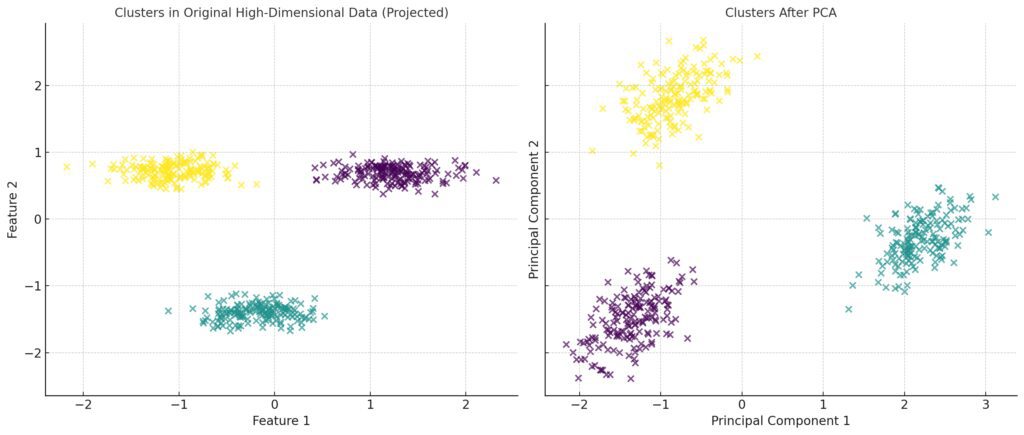
Right Plot (After PCA): Displays the data transformed into two principal components using PCA. The clusters are more distinct, demonstrating how PCA consolidates information and enhances separations between groupings.
Improving Customer Segmentation
Retailers often struggle to interpret AI-driven recommendations. PCA groups customers based on purchasing habits, preferences, and demographics into clear segments.
This empowers businesses to:
- Design targeted marketing campaigns.
- Explain why certain offers or products are suggested, fostering customer trust in AI tools.
Inventory Management and Demand Forecasting
PCA helps retailers predict demand fluctuations by analyzing sales trends, seasonality, and external factors like weather or holidays. Simplified data visualization aids supply chain managers in making informed decisions.
Enhancing AI Education with PCA
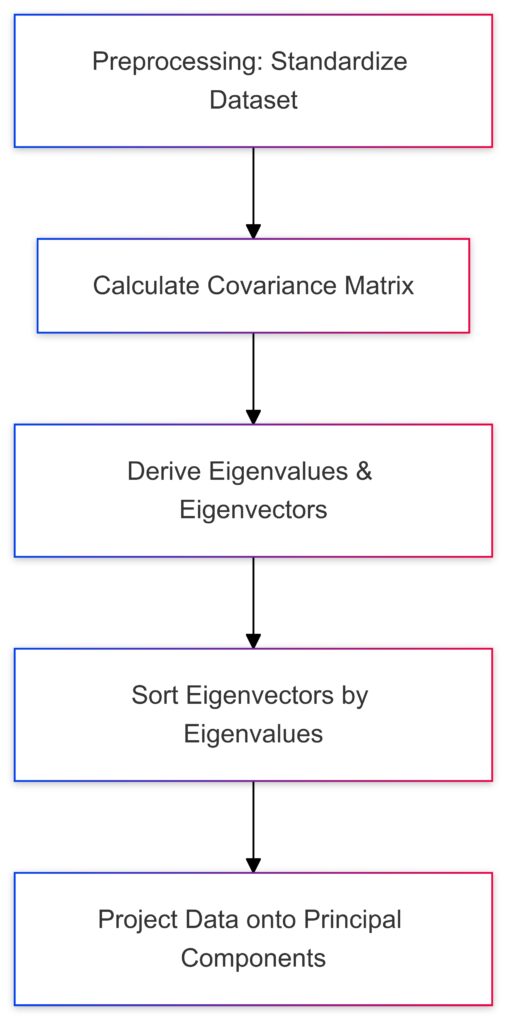
The step-by-step process of Principal Component Analysis from data preprocessing to dimensionality reduction.
Teaching Models to Learn Explanations
In educational settings, PCA demonstrates how data transformations impact machine learning. By visualizing dimensionality reduction, students grasp the trade-offs between data simplicity and interpretability.
- PCA-based visualizations clarify decision boundaries in complex models, making AI concepts accessible to learners.
Practical Case Studies for Explainable AI
Using PCA in classroom case studies—like analyzing climate change data—brings explainable AI concepts to life. Real-world relevance encourages deeper understanding.
Let’s now explore the future of PCA in explainable AI and its role in shaping transparent, trustworthy AI systems.
The Future of PCA in Explainable AI
Principal Component Analysis (PCA) is evolving to meet the growing demands of explainable AI (XAI). As AI systems become more complex, the need for transparency and trustworthiness increases. Let’s examine the advancements and trends shaping PCA’s role in XAI.
Advanced Techniques to Improve PCA in XAI
Nonlinear Variants: Beyond Traditional PCA
Traditional PCA assumes linear relationships in data. However, real-world datasets often exhibit nonlinear patterns. Advanced techniques like Kernel PCA and Sparse PCA address these limitations:
- Kernel PCA applies nonlinear transformations, enabling PCA to capture intricate patterns in data such as image recognition or sensor data in IoT systems.
- Sparse PCA enhances interpretability by retaining sparsity in the principal components, making it easier to connect components back to original features.
These techniques provide richer insights while maintaining explainability, especially in high-stakes industries like healthcare and finance.
Hybrid Models: Combining PCA with Deep Learning
Integrating PCA with deep learning methods boosts both accuracy and interpretability. For instance:
- PCA can preprocess data, reducing dimensionality before feeding it into a neural network, improving training efficiency.
- By mapping neural network outputs back to principal components, hybrid models provide more comprehensible explanations for predictions.
This synergy enables advanced AI systems to explain their behavior while maintaining state-of-the-art performance.
Automating PCA for Explainable Workflows
Auto-PCA in Machine Learning Pipelines
Emerging tools automate PCA selection and application. Auto-PCA algorithms:
- Dynamically determine the optimal number of components.
- Adapt to data variations, ensuring minimal information loss.
These advancements simplify the workflow for data scientists, embedding PCA seamlessly into explainable AI frameworks.
Integration with Explainability Frameworks
Modern XAI platforms now incorporate PCA as a foundational tool. By linking PCA with methods like LIME or SHAP, these platforms produce layered explanations, from global data trends to individual predictions.
For example, AI models in fraud detection systems can show which principal components (clusters of behavior) contributed to flagging a transaction.
Ethical Implications of PCA in Explainable AI
Reducing Bias in AI Models
PCA plays a key role in identifying and mitigating biases in data. By analyzing principal components, developers can detect skewed data distributions or redundant features that perpetuate inequality.
For example, in recruitment AI:
- PCA can expose patterns where certain demographic features dominate predictions, prompting adjustments for fairness.
Transparency for Trustworthy AI
PCA aids in building trust by making AI models more interpretable. For regulatory compliance, organizations can use PCA to demonstrate how decisions are made, especially in industries like banking and healthcare.
The Road Ahead for PCA in AI
Augmented PCA for Big Data
As datasets grow larger and more complex, traditional PCA struggles with computational limits. Emerging innovations like Incremental PCA and Distributed PCA scale the technique for big data environments:
- Incremental PCA processes data in batches, suitable for real-time applications like stock market predictions.
- Distributed PCA splits computation across systems, enabling analysis of massive datasets in cloud environments.
Democratizing Explainable AI with PCA
Accessible tools and frameworks are making PCA easier for non-experts to apply. Interactive dashboards and visualization tools allow stakeholders to explore principal components without needing deep technical expertise.
For instance, policymakers can use PCA-driven insights to understand societal trends or environmental changes, fostering informed decisions.
Final Thoughts: Balancing Accuracy and Insight with PCA
The future of PCA in explainable AI lies in its adaptability and integration with cutting-edge technologies. Whether simplifying datasets, enhancing model performance, or promoting fairness, PCA remains a cornerstone of interpretable AI.
By striking the right balance between accuracy and insight, PCA continues to shape the future of transparent, trustworthy AI systems.
FAQs
What are the limitations of PCA in explainable AI?
One major limitation is that PCA transforms features into principal components, which are abstract combinations of the original variables. This abstraction can make direct interpretations challenging.
For example, if PCA identifies “Principal Component 2” as significant, it may combine factors like income and spending habits into one metric. Explaining its exact contribution to an outcome (e.g., credit approval) requires extra effort to map components back to original variables.
Another limitation is the risk of losing important low-variance information, which might be crucial in niche scenarios like detecting rare diseases or anomalies in cybersecurity.
How does PCA compare to other dimensionality reduction techniques?
PCA is linear, focusing on capturing variance through orthogonal transformations. Other techniques, such as t-SNE or UMAP, emphasize nonlinear relationships and clustering.
For example, PCA might summarize data for a sales analysis by identifying general trends, like seasonal peaks. On the other hand, t-SNE could reveal intricate groupings, such as customer subsegments based on niche product preferences.
Each method serves different purposes, and PCA is often preferred for its simplicity and computational efficiency.
How does PCA enhance data visualization in XAI?
PCA reduces data dimensions, making complex datasets easier to visualize in 2D or 3D plots. This helps domain experts identify patterns and anomalies.
For instance, in a biological dataset with thousands of genes, PCA can create a 2D scatterplot where each point represents a sample, such as cancer and non-cancer tissues. Clusters in the plot reveal similarities, aiding in diagnosis and explanations.
Can PCA handle missing or incomplete data?
PCA is sensitive to missing data, as it relies on a complete dataset for accurate computation. However, preprocessing techniques like imputation (filling missing values) or specialized adaptations like Robust PCA can address this issue.
For example, in climate science datasets with missing temperature readings, imputation methods fill gaps, enabling PCA to analyze global weather patterns effectively.
Is PCA applicable to neural networks or deep learning?
Yes, PCA can complement deep learning by serving as a preprocessing step to reduce input dimensions, speeding up training and improving model interpretability.
For example, in image recognition, PCA can reduce pixel data before feeding it into a convolutional neural network. This preprocessing not only accelerates computations but also highlights key visual features, enhancing explanations for predictions.
How do PCA and SHAP work together in explainable AI?
SHAP (Shapley Additive Explanations) assigns importance scores to features, explaining their contributions to a prediction. When combined with PCA, SHAP can break down principal components into their original variables, improving interpretability.
For example, in a model predicting energy consumption, PCA might show “Principal Component 1” is crucial. SHAP can further explain it as a combination of temperature, humidity, and appliance usage, making the explanation actionable for energy-saving strategies.
Can PCA reduce bias in AI models?
PCA can help identify and reduce bias by detecting patterns that disproportionately influence predictions. By analyzing principal components, developers can assess whether irrelevant or biased features dominate a model’s decision-making.
For instance, in hiring algorithms, PCA might reveal that demographic features like age or gender significantly contribute to “Principal Component 1.” This insight allows developers to adjust the dataset or model to minimize unfair biases while maintaining accuracy.
How does PCA help with feature selection?
PCA aids in feature selection by prioritizing variables that contribute the most to data variance. While it doesn’t explicitly select features, it identifies the most impactful ones, enabling manual or automated selection.
For example, in predicting customer churn, PCA might highlight features like “contract duration” and “service usage frequency” as significant contributors. These can then be directly used in the final model, ensuring simplicity and relevance.
Is PCA suitable for all types of data?
PCA works best with numerical data where linear relationships dominate. It’s less effective for categorical data unless encoded (e.g., one-hot encoding) or used with hybrid methods like Categorical PCA.
For example, in a retail dataset with customer preferences (“yes” or “no” for certain products), PCA requires preprocessing to handle such binary or categorical data. Without it, results may be skewed or misinterpreted.
How does PCA perform with imbalanced datasets?
PCA doesn’t inherently address class imbalance, as it focuses on maximizing variance rather than preserving minority class information. However, careful preprocessing or hybrid approaches can make PCA more effective.
For instance, in fraud detection with heavily imbalanced data (rare fraudulent cases), using PCA alone might obscure minority patterns. Pairing PCA with oversampling techniques (like SMOTE) can ensure that the reduced dimensions still capture fraudulent behavior.
How many principal components should I select for my dataset?
The number of principal components depends on the trade-off between retained variance and reduced dimensionality. A common threshold is retaining 90-95% of the variance.
For example, in a dataset with 100 features, PCA might reveal that the first 10 components capture 92% of the variance. In such cases, selecting those 10 components balances complexity and information retention.
Can PCA detect anomalies or outliers?
Yes, PCA is often used in anomaly detection by identifying data points that deviate significantly from the principal component structure.
For instance, in a network security dataset, PCA might reveal unusual activity patterns (e.g., spiking network traffic) as outliers. These anomalies can then be flagged for further investigation.
How does PCA handle noise in data?
PCA reduces noise by discarding low-variance components, which often capture random fluctuations or irrelevant details. This makes the data cleaner and models more robust.
For example, in audio processing, PCA can filter out background noise by focusing on principal components representing the primary sound patterns, such as speech or music tones.
Does PCA work with time-series data?
Yes, but additional steps are needed to preserve temporal relationships. PCA is often combined with techniques like sliding windows or feature extraction to handle time-series data effectively.
For example, in stock market analysis, PCA can summarize historical price movements across multiple companies. By segmenting the data into time windows, PCA highlights trends and correlations, aiding in predictions and explanations.
What tools or libraries support PCA for explainable AI?
Several tools and libraries provide robust implementations of PCA:
- Scikit-learn: A popular Python library offering easy-to-use PCA functions.
- TensorFlow and PyTorch: Support PCA preprocessing for deep learning workflows.
- MATLAB: Frequently used in academic and engineering applications.
For instance, in Python, you can use Scikit-learn’s PCA() function to perform dimensionality reduction and visualize results, making it a go-to choice for explainable AI applications.
How can PCA improve model debugging?
PCA helps debug models by revealing redundant or noisy features and identifying correlations between variables.
For example, in an AI model for sentiment analysis, PCA might show that certain redundant word embeddings contribute little to overall variance. By removing these, you streamline the model and improve interpretability.
Resources
Books
- “The Elements of Statistical Learning” by Hastie, Tibshirani, and Friedman
This comprehensive book covers PCA in the context of machine learning and statistical methods. It provides mathematical depth and practical examples, ideal for understanding PCA’s theory and applications. - “Hands-On Machine Learning with Scikit-Learn, Keras, and TensorFlow” by Aurélien Géron
A practical guide for machine learning enthusiasts, this book includes hands-on implementations of PCA using Python, focusing on real-world applications. - “An Introduction to Statistical Learning” by Gareth James et al.
A lighter, more beginner-friendly version of “The Elements of Statistical Learning,” it includes PCA explanations with accessible examples.
Articles and Blogs
- “A Step-by-Step Introduction to Principal Component Analysis” by Towards Data Science
A beginner-friendly guide with Python code and clear visuals for understanding PCA.
Read here - “How PCA Works in Machine Learning and Why It Matters” by Analytics Vidhya
Focuses on the practical applications of PCA in different fields, with easy-to-follow explanations.
Read here - OpenAI Blog: Explainable AI
While not specific to PCA, this blog discusses transparency in AI models and highlights methods that complement PCA for interpretability.
Visit OpenAI Blog
Research Papers
- “Principal Component Analysis: A Review and Recent Developments” (Journal of Machine Learning Research)
A detailed overview of PCA’s advancements and applications in modern machine learning.
Read here - “Dimensionality Reduction for Explainable AI” by Samek et al.
Discusses the role of PCA and related techniques in making AI systems more interpretable. - “Interpretable Machine Learning: A Guide for Making Black Box Models Explainable” by Christoph Molnar
A must-read for explainable AI enthusiasts, this guide discusses PCA in the context of feature reduction and interpretability.
Tools and Libraries
- Scikit-learn Documentation
Offers detailed explanations and code examples for PCA, including visualization and parameter tuning.
Scikit-learn PCA Guide - TensorFlow and PyTorch Documentation
Both frameworks support PCA preprocessing for deep learning workflows.
TensorFlow PCA | PyTorch PCA - Google Colab
Use pre-built notebooks to experiment with PCA in Python. A good starting point for beginners.
Google Colab
Communities and Forums
- Kaggle Community
Discuss PCA-related projects and seek advice from a community of data scientists.
Kaggle Forums - Reddit: r/MachineLearning
Participate in discussions about PCA and other dimensionality reduction techniques in AI.
Reddit ML Community - Stack Overflow
Ask specific questions about PCA implementation and troubleshooting in Python or other languages.
Visit Stack Overflow


