
Choosing the right classification algorithm can make or break your analysis. Quadratic Discriminant Analysis (QDA) and Linear Discriminant Analysis (LDA) are two popular methods, often used in machine learning and statistics for classification tasks.
While they seem similar at first glance, their underlying assumptions and applications differ. In this guide, we’ll dive deep into their mechanics and explore when to use each.
What Are QDA and LDA?
Overview of Discriminant Analysis
Both LDA and QDA are supervised learning methods used for classification. They model the distribution of each class and use Bayes’ theorem to calculate probabilities, assigning new data points to the most likely class.
- LDA assumes that the covariance matrices of all classes are the same, leading to linear decision boundaries.
- QDA allows each class to have its own covariance matrix, leading to quadratic decision boundaries.
Key Assumptions: LDA vs. QDA

Assumes a linear decision boundary.
Assumes shared covariance matrix across classes.
QDA (Quadratic Discriminant Analysis):
Assumes a quadratic decision boundary.
Allows class-specific covariance matrices.
Assumptions of Linear Discriminant Analysis
- The data for each class comes from a multivariate normal distribution.
- Classes share identical covariance matrices.
- The resulting decision boundary is linear.
What this means: LDA works best when your data has clear, linear separability and follows the assumptions of homoscedasticity (equal variance across classes).
Assumptions of Quadratic Discriminant Analysis
- The data for each class comes from a multivariate normal distribution, just like LDA.
- Each class has its own covariance matrix, allowing for more flexibility.
- The decision boundary is quadratic.
What this means: QDA shines when your data is complex and has class-specific distributions with significant differences in their variances.
Performance Differences: LDA vs. QDA
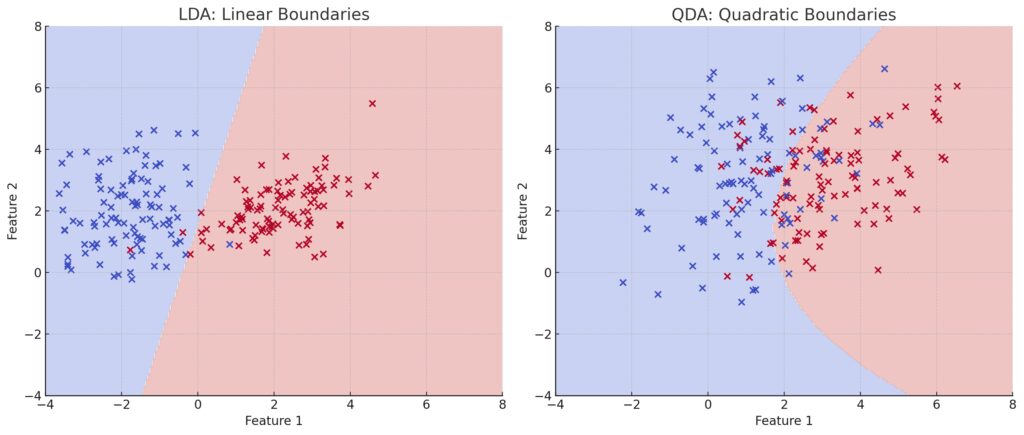
Right Panel (QDA): The decision regions are quadratic, demonstrating flexibility in modeling class-specific covariance.
When to Use LDA
- Linearly Separable Data: LDA thrives when the relationship between classes can be separated by a straight line or plane.
- Small Sample Sizes: Since it estimates fewer parameters, LDA is less prone to overfitting, especially with small datasets.
- Balanced Covariance Structures: Works well if the assumption of shared covariance holds true.
Example: Classifying male and female heights, where height distributions are similar but offset.
When to Use QDA
- Non-linear Boundaries: If your data demands curved separation between classes, QDA’s quadratic approach fits the bill.
- Large Sample Sizes: Since QDA estimates separate covariance matrices for each class, it requires more data to make stable estimates.
- Class-Specific Variance: QDA excels when each class has unique covariance structures, like in multi-modal or heavily skewed datasets.
Example: Distinguishing handwritten digits where shape complexity varies greatly between classes.
Computational Complexity
Simplicity of LDA
LDA is computationally lighter due to its single covariance matrix estimation. This simplicity makes it faster, especially on large datasets with many features.
Demands of QDA
QDA involves estimating a covariance matrix for each class. This increases computational cost, especially when the number of classes or features grows.
Practical Applications: LDA vs. QDA
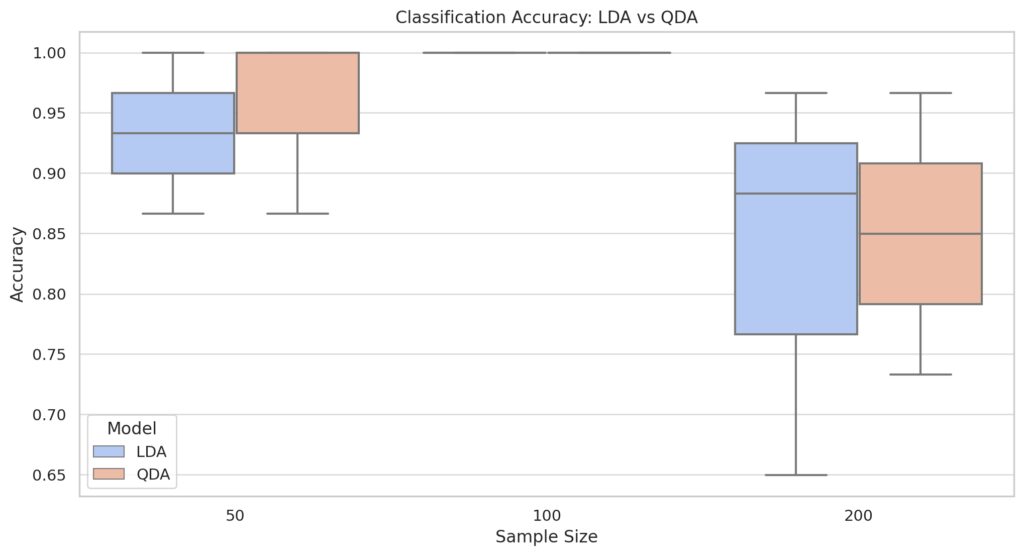
Smaller sample sizes generally lead to lower accuracy for both models, with QDA often performing worse due to overfitting.
Larger sample sizes improve performance, reducing the variability in accuracy.
Variance Impact:
Lower class separation (low variance) results in more challenging classification, with both models showing reduced accuracy.
Higher class separation (high variance) benefits both models, but LDA retains a simpler boundary, making it more robust with limited data.
LDA in Action
LDA is often the go-to method when the data exhibits linear separability or when you want to avoid overfitting on smaller datasets. Common use cases include:
- Face Recognition: Simplifies feature extraction for linear separation in images.
- Credit Risk Modeling: Works well in differentiating low- and high-risk borrowers when data distributions overlap consistently.
- Medical Diagnostics: Useful for classifying diseases with consistent linear patterns, such as diabetes diagnosis based on glucose levels.
QDA in Action
QDA comes into play for more complex scenarios where decision boundaries need flexibility. Use cases include:
- Speech Recognition: Distinguishing phonemes or accents with unique vocal variance.
- Image Classification: Especially effective when objects vary widely in shape or size across categories.
- Genomics: Classifying gene expression profiles with distinct variances across groups.
How to Choose Between LDA and QDA
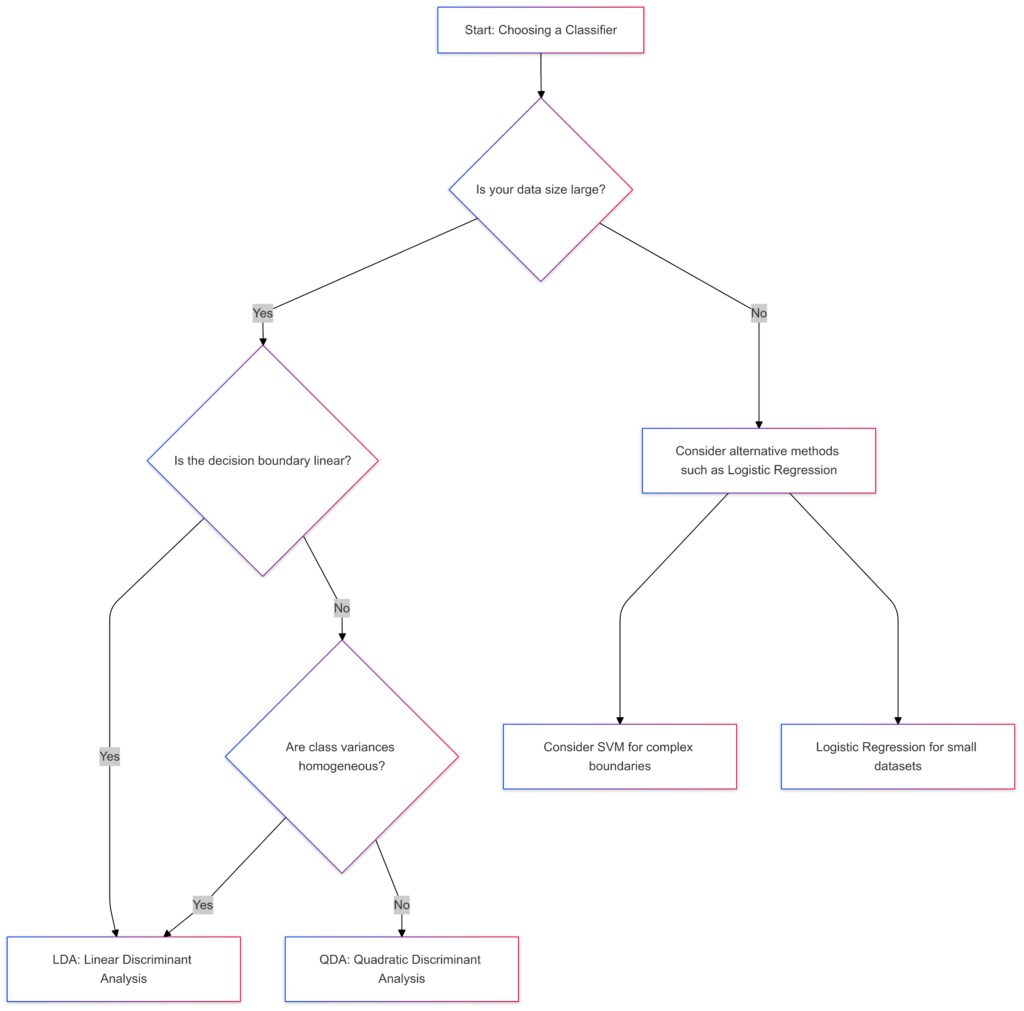
If the decision boundary is linear: LDA.
If the decision boundary is not linear and class variances are not homogeneous: QDA.
Small Dataset:
Consider simpler methods like Logistic Regression.
Use SVM for complex boundaries in low-data scenarios.
Steps to Decide
- Examine Your Data: Visualize class distributions. Are the boundaries linear, or do they curve?
- Check Sample Size: If your dataset is small, prefer LDA to avoid unstable covariance estimates in QDA.
- Test Assumptions: Evaluate whether class covariances are similar. Use statistical tests or inspection.
- Compare Performance: Use cross-validation to compare accuracy, precision, and recall of both models on your dataset.
Rule of Thumb
- Start with LDA as it’s simpler and requires fewer assumptions.
- Switch to QDA if LDA underperforms or if the data shows clear non-linear separability.
Beyond LDA and QDA: Alternative Approaches
If neither LDA nor QDA fits perfectly, consider these advanced methods:
- Logistic Regression: A versatile option that doesn’t assume normality or homoscedasticity.
- Support Vector Machines (SVM): Handles non-linear boundaries effectively with kernel functions.
- Naive Bayes: A simpler probabilistic approach for high-dimensional datasets.
Each offers unique strengths, but LDA and QDA remain foundational for understanding how data distributions influence classification.
Real-World Case Studies: LDA vs. QDA in Action
Case Study 1: Predicting Loan Defaults
Scenario: A financial institution wants to predict whether a loan applicant will default based on features like income, credit score, and debt-to-income ratio.
Model Performance:
- LDA: Performed well, assuming consistent class variances. The linear decision boundary effectively separated low- and high-risk applicants.
- QDA: Overfitted due to the small dataset and lacked meaningful improvement in classification accuracy.
Takeaway: LDA is the better choice for datasets with simple relationships and limited size.
Case Study 2: Handwritten Digit Recognition
Scenario: A dataset of digit images is used to classify numbers from 0 to 9. The features include pixel intensities and gradients.
Model Performance:
- LDA: Struggled with digits like 3 and 8, where non-linear boundaries are critical for accurate separation.
- QDA: Captured the complex variance across digit shapes, significantly improving classification accuracy.
Takeaway: QDA is ideal for datasets with non-linear relationships and distinct class variances.
Comparing Accuracy and Efficiency
Accuracy Trade-offs
- LDA: Performs consistently when class covariance matrices are similar. Can suffer in non-linear datasets.
- QDA: Excels with non-linear separability but may overfit small datasets due to higher parameter estimation.
Efficiency Considerations
- LDA: Faster training and lower memory usage make it preferable for high-dimensional data or resource-constrained applications.
- QDA: Higher computational cost and memory requirements mean it’s better suited for well-funded, large-scale projects.
Practical Tips for Implementation
For Linear Discriminant Analysis
- Preprocess data by scaling features to ensure fairness in variance comparisons.
- Test linear separability visually or with metrics like Mahalanobis distance.
- Use LDA when interpretability is crucial, as it provides clear decision boundaries.
For Quadratic Discriminant Analysis
- Ensure a large sample size to stabilize covariance matrix estimations.
- Test class-specific covariance with statistical tools like Box’s M test.
- Regularize QDA for high-dimensional data to prevent overfitting.
Hybrid Approaches: Combining the Best of Both
In some cases, neither pure LDA nor QDA works perfectly. Hybrid approaches include:
- Regularized Discriminant Analysis (RDA): Balances between LDA and QDA by introducing a regularization parameter.
- Kernel Discriminant Analysis: Projects data into higher dimensions to handle non-linear relationships while maintaining computational efficiency.
Both LDA and QDA are valuable tools in your classification arsenal. The key is understanding their assumptions, strengths, and limitations to match the method to the problem at hand.
When to Choose LDA
- Linear Data Patterns: If your data seems linearly separable.
- Small Dataset: Works well with limited data, avoiding overfitting.
- Homogeneous Class Variance: Covariance structures across classes are similar.
- Efficiency Required: Faster to train and compute, especially in high-dimensional settings.
- Interpretability: Offers clear, interpretable decision boundaries.
Example Use Cases:
- Predicting binary outcomes like loan defaults.
- Classifying medical conditions with consistent linear trends.
When to Choose QDA
- Non-linear Data Patterns: Use if boundaries between classes curve or exhibit complexity.
- Large Dataset Available: More data helps stabilize class-specific covariance matrix estimates.
- Heterogeneous Variance: Classes differ significantly in variance or distribution shapes.
- Flexibility Needed: Handles multi-modal and skewed distributions effectively.
Example Use Cases:
- Recognizing handwritten digits or complex shapes.
- Distinguishing voice tones in speech recognition.
General Tips
- Start Simple: Begin with LDA—fewer assumptions and lower risk of overfitting.
- Switch to QDA: If LDA performs poorly and your data shows non-linear separability.
- Validate Performance: Use cross-validation to compare models on your dataset.
- Consider Alternatives: If neither works, explore logistic regression, SVM, or Naive Bayes.
By aligning your model choice with your data’s structure and size, you’ll make the most of these powerful methods.
FAQs
When is overfitting a concern with QDA?
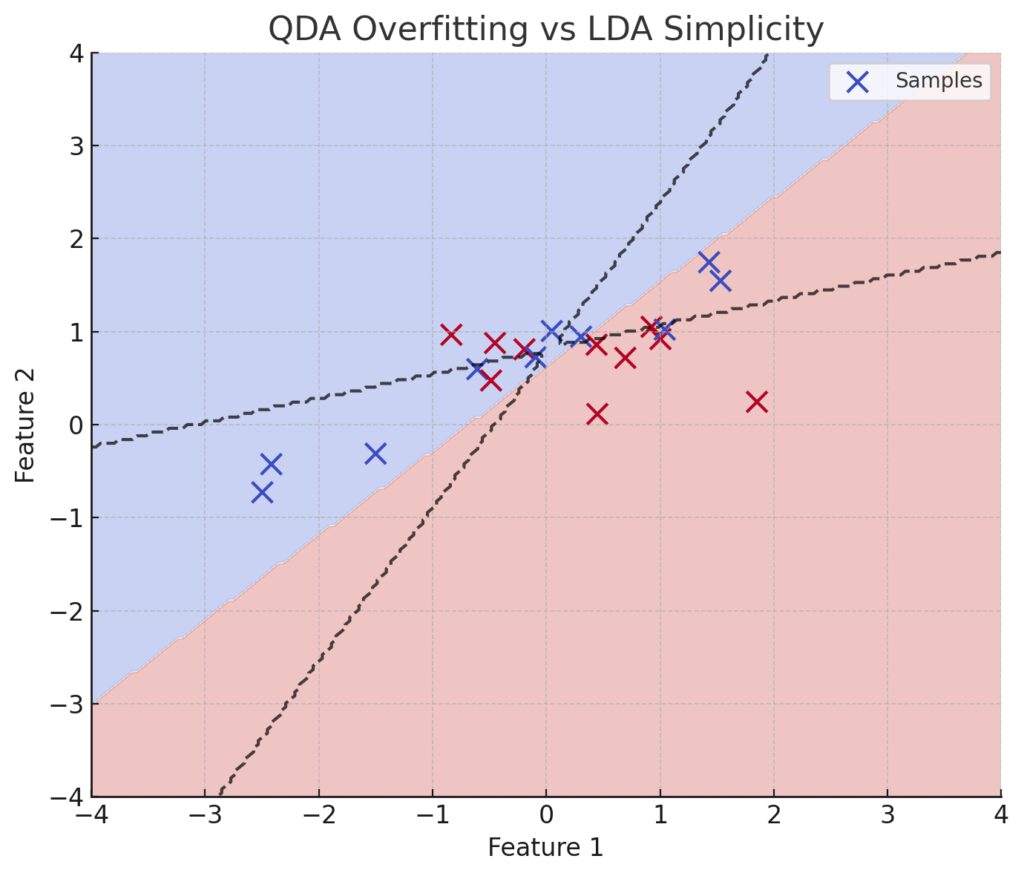
Dashed Lines (QDA): Overfitting is evident in the highly specific and curved boundaries that adapt excessively to the small number of samples.Solid Regions (LDA): Simpler, linear boundaries provide a more general solution, avoiding overfitting.Sparse Data: The limited number of samples is highlighted, showing how QDA’s flexibility can lead to poor generalization.
QDA is prone to overfitting in small datasets because it estimates a covariance matrix for each class, requiring more data points for stable estimates. If your dataset lacks size, QDA might capture noise as patterns.
Example: If you’re analyzing a small sample of customer purchase behaviors, QDA might misinterpret random fluctuations as meaningful trends.
How do I know if the data is linearly separable?
You can visualize your data with scatterplots or use dimensionality reduction techniques like PCA to assess separability. Alternatively, tools like the Mahalanobis distance or even cross-validation can reveal if linear models struggle.
Example: For classifying “Pass” or “Fail” based on hours studied and attendance, plot the data. If the points cluster into two distinct, straight-line separable groups, LDA is likely a good fit.
Can I use LDA or QDA for multi-class classification?
Yes! Both LDA and QDA can handle multi-class problems by modeling the distribution of each class and assigning probabilities. However, QDA’s flexibility is especially beneficial when class variances differ significantly.
Example: In a multi-class task like recognizing different dog breeds based on size and fur density, QDA might excel if smaller breeds (like Chihuahuas) and larger breeds (like Labradors) exhibit very different variances.
What is a hybrid approach, and when should I consider one?
Hybrid approaches like Regularized Discriminant Analysis (RDA) combine elements of LDA and QDA. They are useful when the data lies between linear and quadratic relationships or when you want to mitigate QDA’s overfitting risk.
Example: In gene expression analysis, where variances between classes are somewhat similar but not entirely identical, RDA could strike the right balance.
Is there a performance trade-off between LDA and QDA?
Yes, there’s a trade-off. LDA is faster and simpler but might fail with non-linear data. QDA, on the other hand, handles complex data but is computationally intensive and prone to overfitting with small datasets.
Example: For real-time facial recognition, where speed is critical, LDA might be preferable. For tasks like classifying geological formations with intricate distributions, QDA would likely outperform.
How do LDA and QDA compare to logistic regression?
Logistic regression doesn’t assume normality or covariance structure, making it more flexible but less efficient for multi-class problems. LDA and QDA excel when their assumptions (normal distribution, linear or quadratic separability) hold.
Example: For predicting binary outcomes like “Yes” or “No” based on numerical data, logistic regression might work better if your data doesn’t meet LDA/QDA assumptions.
Can LDA handle high-dimensional data?
Yes, but LDA performs better in high-dimensional settings when the number of features is much lower than the number of samples. If the number of features approaches or exceeds the number of samples, overfitting becomes a risk.
Example: In text classification (e.g., spam detection), where features are word frequencies, LDA can be effective with proper dimensionality reduction, like PCA, to avoid overfitting.
Is feature scaling necessary for LDA and QDA?
Yes, feature scaling is important for both models. Without scaling, features with larger ranges might dominate the covariance calculations, skewing the results.
Example: If you’re classifying plants based on height (measured in centimeters) and chlorophyll content (a small percentage), scaling ensures both features contribute equally to the model.
How do I interpret the decision boundaries of LDA and QDA?
LDA creates straight-line decision boundaries, while QDA produces curved boundaries that adapt to class-specific variance. Visualizing these boundaries helps assess model fit and separability.
Example: In a 2D space, LDA might create a single diagonal line to separate two groups, whereas QDA could create a parabolic or elliptical boundary for more complex data distributions.
What if my data doesn’t follow normal distribution?
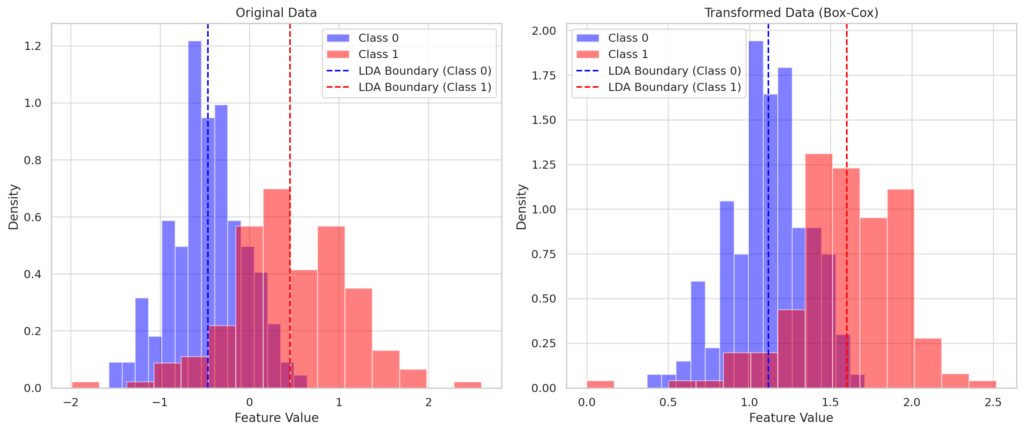
The density histograms for each class are plotted.
LDA’s decision boundaries (dashed lines) show linear separation but are influenced by non-normality.
Right Panel (Box-Cox Transformed Data):
The transformation improves normality, and the LDA boundaries align better with the adjusted densities.
Both LDA and QDA assume multivariate normality. If your data deviates significantly, their performance might degrade. In such cases, consider non-parametric methods like k-nearest neighbors (k-NN) or SVMs, or transform your data to approximate normality.
Example: For skewed financial data (e.g., income distributions), applying a log transformation can help satisfy normality assumptions before using LDA or QDA.
How does sample size affect LDA and QDA?
LDA is more stable with smaller sample sizes since it estimates a single covariance matrix. QDA, which estimates a matrix per class, requires a larger sample size for reliable parameter estimation.
Example: In a dataset with only 50 samples split into two classes, LDA would likely outperform QDA due to fewer parameters to estimate.
Can LDA or QDA handle imbalanced datasets?
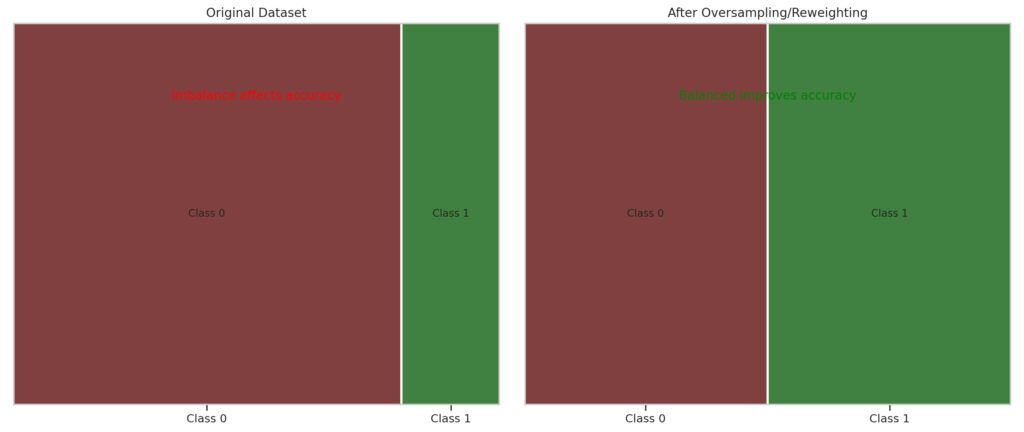
Shows the original class proportions with a significant imbalance (e.g., Class 0 dominating over Class 1).
Annotation highlights that imbalance can negatively impact classification accuracy for both LDA and QDA.
Right Panel (Balanced Dataset):
Simulates the effect of oversampling or reweighting to achieve balanced class proportions.
Annotation emphasizes that balancing improves accuracy and helps both models perform better.
Imbalanced datasets can bias both LDA and QDA toward the majority class. Address this by balancing the dataset through techniques like oversampling (e.g., SMOTE) or class weighting during training.
Example: In fraud detection, where fraudulent cases are rare, oversampling fraud instances can help LDA or QDA learn both classes effectively.
How do I validate my choice of LDA or QDA?
Use techniques like k-fold cross-validation or leave-one-out cross-validation to compare the performance of both models on your dataset. Evaluate metrics like accuracy, precision, recall, and F1-score for a holistic view.
Example: For a dataset on disease classification, you might find that LDA has higher precision but QDA has better recall, helping you choose based on your application’s needs.
What’s the role of regularization in LDA and QDA?
Regularization reduces overfitting by penalizing overly complex models. In LDA, shrinkage methods like ridge regression can be used. In QDA, regularized QDA (R-QDA) limits class covariance flexibility to prevent instability.
Example: In gene expression datasets, where the number of features is far greater than samples, regularized LDA or QDA can stabilize performance.
How do outliers affect LDA and QDA?
Outliers can distort covariance matrices and means, reducing accuracy. Preprocessing techniques like outlier removal or robust scaling can mitigate this.
Example: In stock market data, a single day of extreme price changes might skew the decision boundaries. Removing or capping outliers ensures more reliable classification.
Can LDA and QDA handle categorical predictors?
No, both LDA and QDA are designed for continuous predictors. For categorical data, consider encoding techniques like one-hot encoding or using other algorithms like logistic regression or decision trees.
Example: To classify customer churn using features like gender (categorical), you’d need to encode gender as numeric before using LDA or QDA.
Are there better alternatives for non-linear separability?
If non-linear separability is key and QDA struggles (e.g., due to small sample size), consider using SVMs with kernels, decision trees, or neural networks. These methods can model complex relationships without assuming specific distributions.
Example: In image recognition tasks, a kernel SVM or CNN (convolutional neural network) might outperform QDA for intricate, non-linear data.
Resources for Learning and Applying LDA and QDA
Foundational Books
- “The Elements of Statistical Learning” by Hastie, Tibshirani, and Friedman
A must-read for anyone in machine learning or statistics, this book provides a solid grounding in discriminant analysis and related methods.
Read it here (free PDF available). - “Pattern Recognition and Machine Learning” by Christopher Bishop
Explores LDA and QDA in depth, alongside other classification algorithms, with a focus on probabilistic approaches.
Online Courses and Tutorials
- StatQuest with Josh Starmer (YouTube)
Offers beginner-friendly video explanations of LDA and QDA with clear visuals and step-by-step instructions.
StatQuest on YouTube. - Andrew Ng’s Machine Learning Course (Coursera)
Covers foundational machine learning techniques, including LDA as part of classification discussions.
Enroll here. - Python for Data Science and Machine Learning Bootcamp (Udemy)
Includes hands-on coding examples of LDA and QDA using Python.
Explore the course.
Libraries and Documentation
- Scikit-learn Documentation
A robust library for machine learning in Python, Scikit-learn includes both LDA (LinearDiscriminantAnalysis) and QDA (QuadraticDiscriminantAnalysis). - R Packages for LDA and QDA
MASS: Includes implementations of LDA and QDA with detailed parameter tuning options.
Learn aboutMASS.caret: Offers a unified framework to train and compare models, including LDA and QDA.
Research Papers and Case Studies
- “Discriminant Analysis and Statistical Pattern Recognition” by G. McLachlan
A comprehensive guide to LDA and QDA in theory and practice.
Get it on Wiley. - Case Study: Handwritten Digit Classification
A practical exploration of LDA and QDA on the MNIST dataset with Python.
Read on Medium. (Search for LDA and QDA MNIST classification examples.)
Practice Platforms
- Kaggle
Participate in competitions or explore datasets to apply LDA and QDA in real-world contexts.
Visit Kaggle. - Google Colab
Experiment with Python code for LDA and QDA in a cloud-based notebook environment.
Start coding on Colab.
Blogs and Articles
- Towards Data Science (Medium)
Features beginner and intermediate-level tutorials on LDA and QDA with hands-on examples.
Read articles. - GeeksforGeeks
Provides step-by-step coding tutorials for LDA and QDA in Python.
Explore tutorials.
Tools for Data Visualization
- Seaborn and Matplotlib (Python)
Ideal for visualizing decision boundaries and class separability.
Seaborn documentation.
Matplotlib documentation. - Tableau Public
A powerful tool for visualizing data distributions to evaluate linear or quadratic separability.
Try Tableau Public.
With these resources, you’ll gain both theoretical understanding and practical expertise in applying LDA and QDA effectively.